


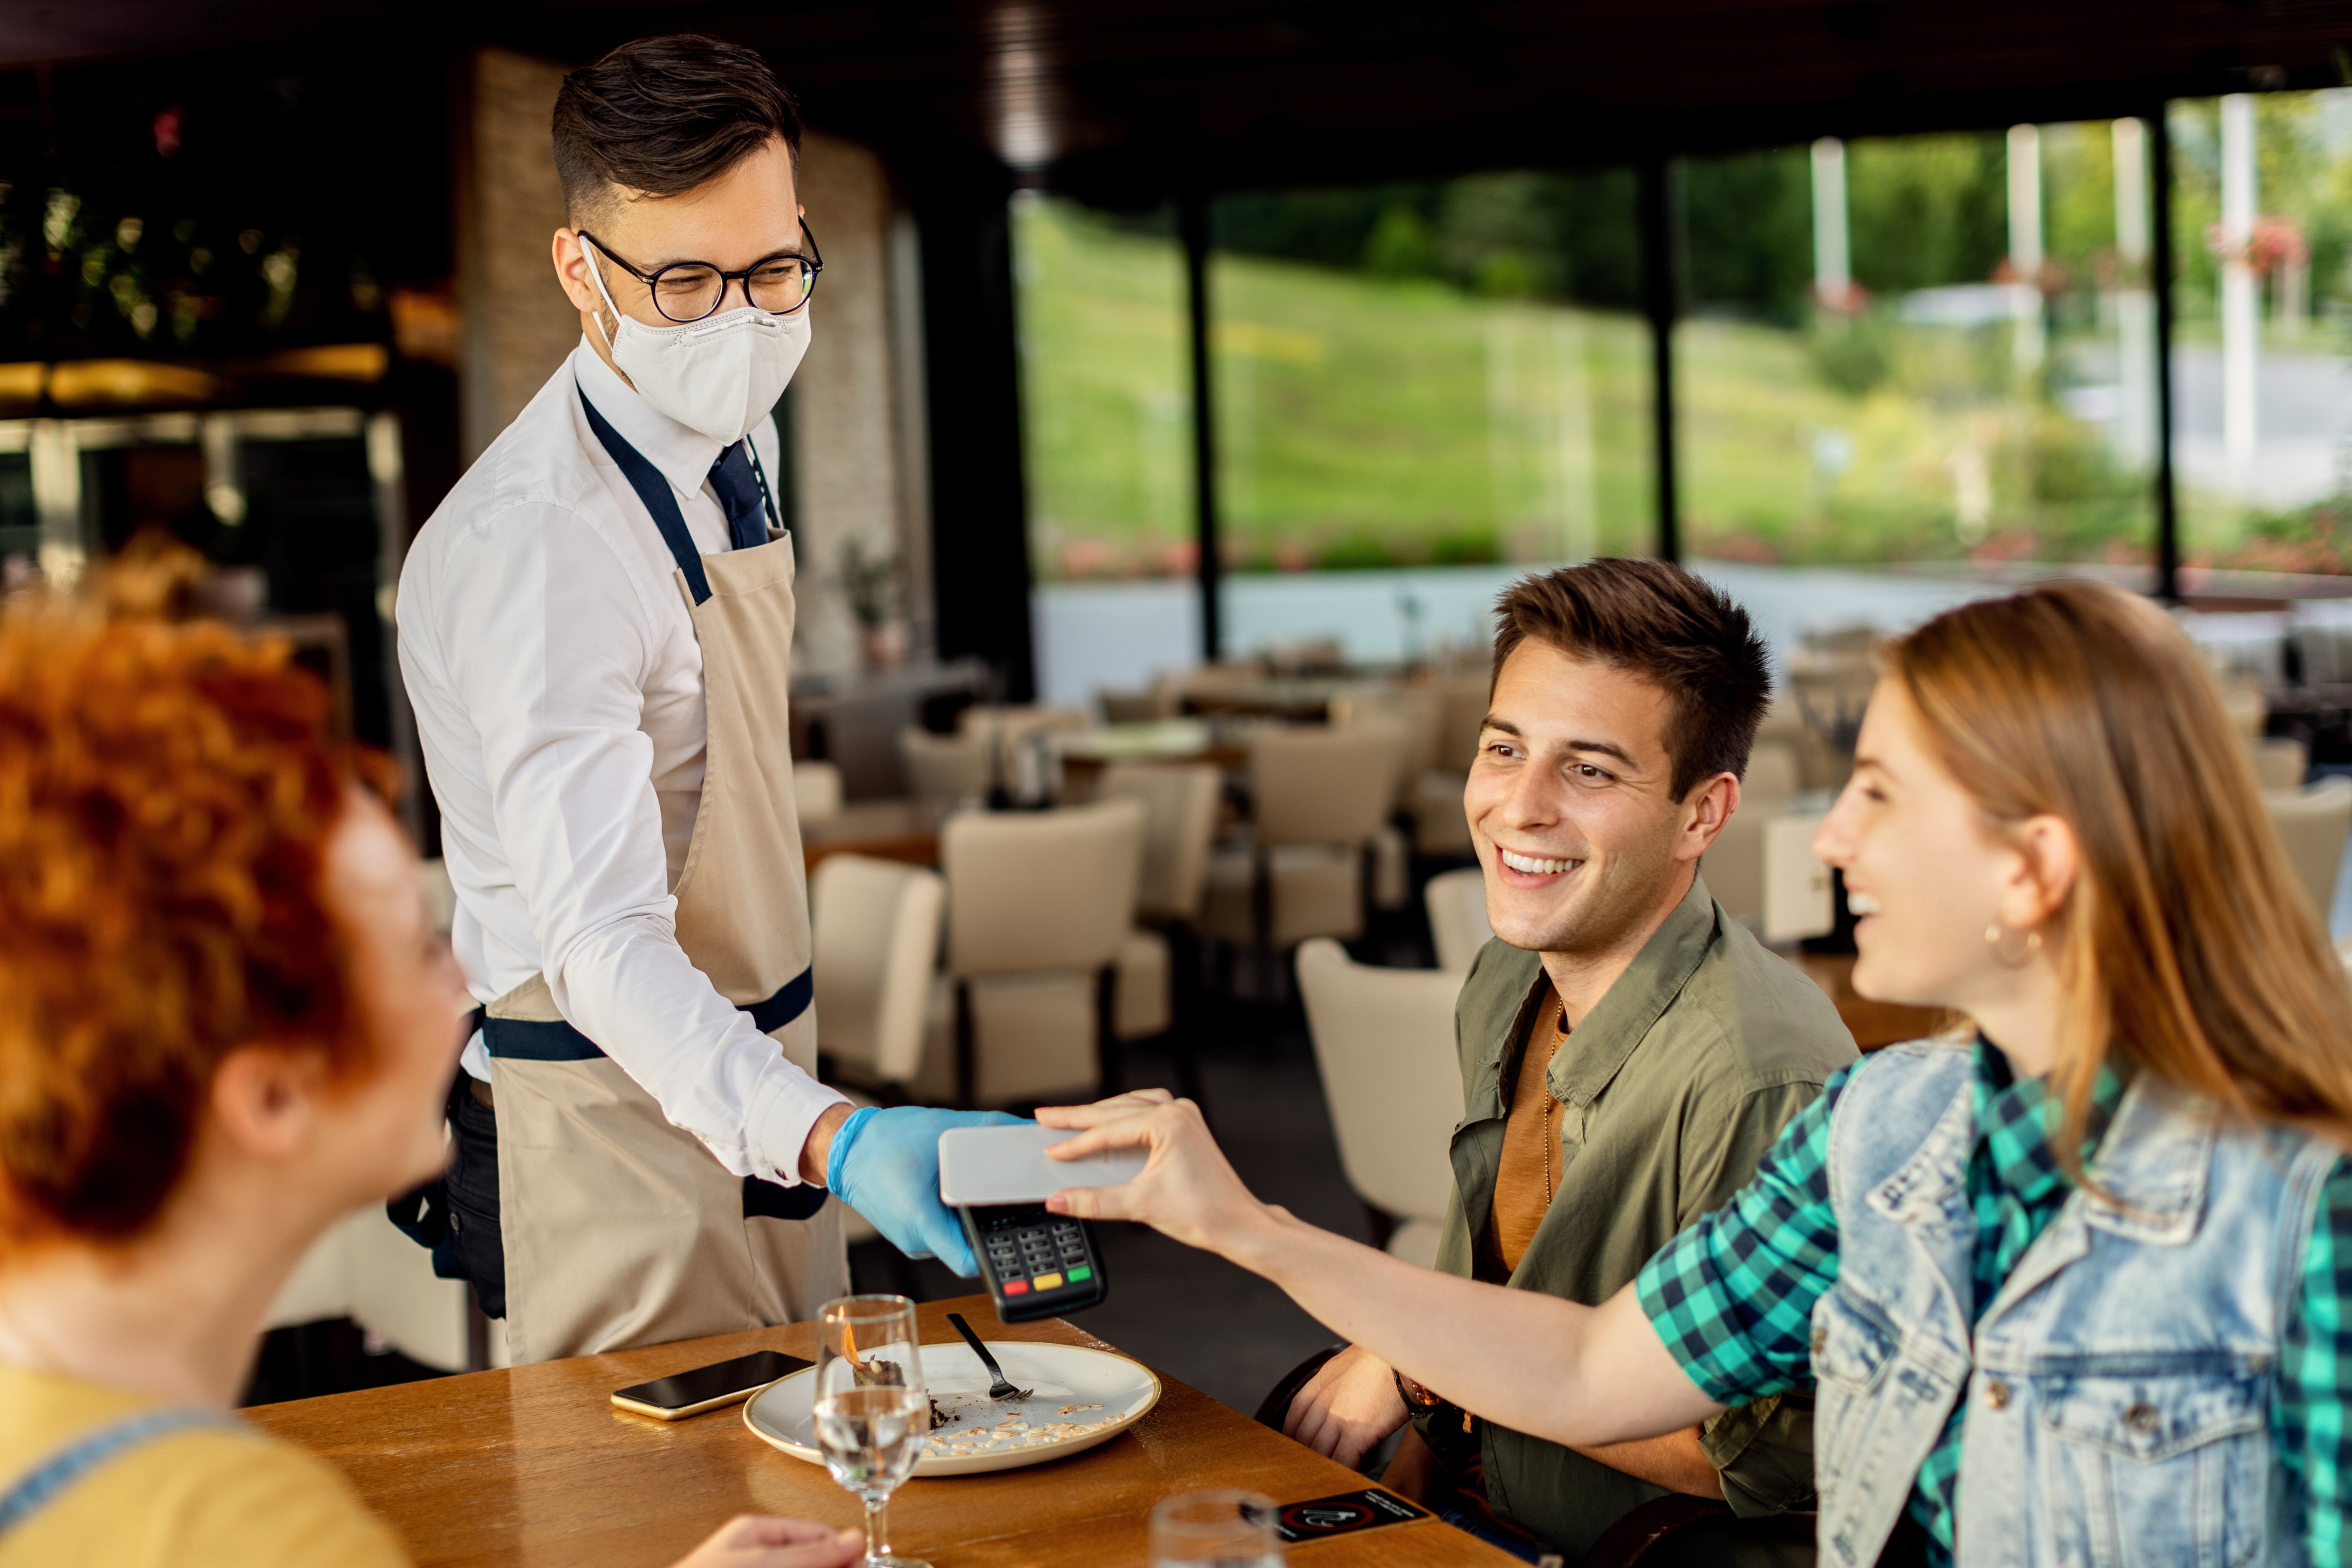
Everyone has likely heard about the dramatic impact the Covid pandemic has had on restaurant sales. In March, it was common for restaurants to have lost 70% or more of their sales from 2019. Since then, we have all been monitoring the progress of sales returning to restaurants. One tool for monitoring the restaurant industry is the Mirus Index which allows us to examine trends daily across thousands of restaurants. Index tracks both sales and traffic patterns for each location, and the trends for both of these metrics leads you to some interesting questions. Have you been tracking both your sales as well as your traffic? Do you see any differences in each metric's trendline?
Sales vs Traffic
March, 2020 will be remembered as a bloodbath for many restaurant companies. Each day there was bad news being heaped upon other bad news. No one was sure how bad things would become. Well, the good news was that sales started to recover before the month of March was completed, and April experienced a significant improvement in sales. But, what about traffic?
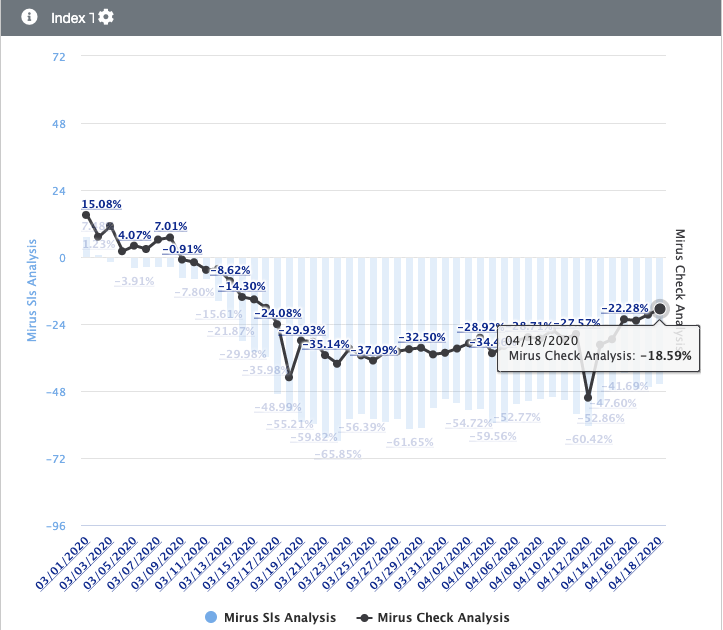
Restaurant traffic fell dramatically in March, but not as much as sales. You can see in the chart below that the worst traffic reduction in Mirus Index was about -50%, while sales -65%, a difference of 1,500 basis points. This chart covers the first seven weeks of the pandemic. By mid-April, sales and traffic have started to improve off of their low points, but the difference between the two metrics is maintained.
What do you think was going on here? If sales dollars are falling faster than traffic, that has to mean that each customer is spending less, on average, than they were the previous year. Could this explain the difference in trend lines? Do you see the same effect in your data?
Fine Dining & Menu Changes
I believe the difference in sales and traffic decreases is explained by the mix of restaurants that are clients of Mirus. Virtually every segment of the industry is represented in the Index, from low AUV locations to high AUV locations. The segment most dramatically affected by Covid included fine dining, and higher end casual dining. Those locations typically have a much higher per guest average sales compared to quick service locations. When the fine dining locations closed, and the quick service remained open (due to their drive-thru), the biggest impact was going to be in dollars and less on traffic. Another explanation for the divergence in trends involves changes that were made to menus. We know of several fast casual and casual dining companies who developed Family Packs costing $30 - $50 for curbside and delivery, and those changes have the obvious effect of driving higher average check, or per guest averages.
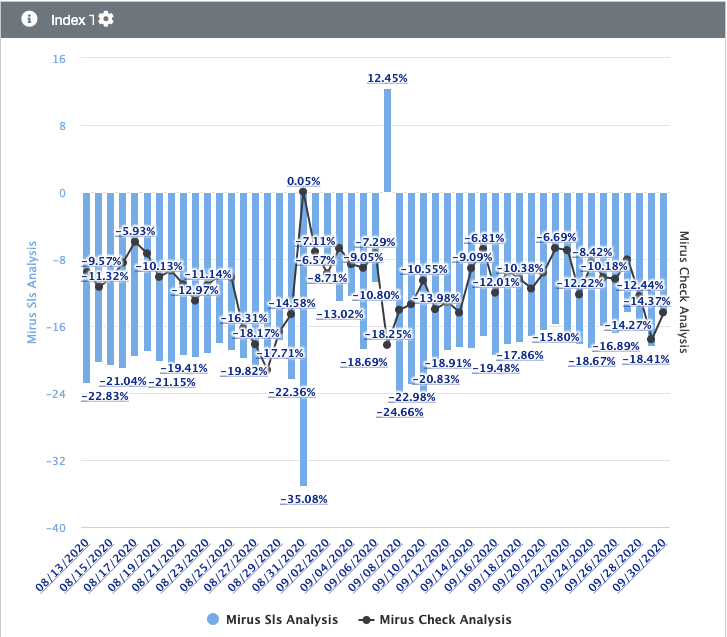
If you believe that hypothesis, then the opposite should be true as well, right? The chart below covers the 7-week period from mid-August to the end of September. Sales continue to improve from the low -20's% to the mid-teens, but traffic during this time appears to be flat, or maybe even negative. Does the re-opening of fine dining restaurants explain this shift if relationship between sales and traffic? I think so.
Consumer Confidence
The shift in dollars spent on food goes further than just moving dollars from one restaurant to another. Grocery stores were the biggest winner in the food business during Covid. Many of the dollars that would have been spent in restaurants in late March moved to grocery because many restaurants were closed. So, as customers choose to go back to restaurants, especially higher end restaurants, the impact on sales is bigger than the impact on traffic counts.
The recent volatility in traffic can be explained by the erratic increase in confidence to return to restaurants. Some of the people are willing to go to a restaurant some of the time, but not with the frequency or consistency they used to visit restaurants. The chart above includes the Labor Day holiday and you can clearly see that Labor Day weekend was the first time sales this year exceeded sales last year, on a same-store basis. For many people, celebrating Labor Day involved either going to a restaurant or ordering delivery.
What Are You Seeing?
If you are a restaurant operator, how do your numbers stack up against Mirus Index? Do you see a shift in Average Check or Per Person Average? Have your beverage sales been reduced? Are you able to sell alcohol?
These are just a couple of additional factors to consider when examining sales and traffic trends during this pandemic.
Hopefully, we will return to something closer to normal in the new year.
Read more details about the impact of COVID-19 on the restaurant industry in our Diary Series here.
Click here to subscribe to the Mirus Blog


.png?width=50&height=50&name=Mirus%20Logo%20(1).png)