


In an era when terms like Data Scientist, and Analyst are commonly used in mass media, it is important to understand that interpreting data can be complicated. It is easy to draw the wrong conclusion. I touched on this point in my material for Restaurant Finance Week last November. You should take caution when measuring your restaurant performance during this Covid period. Read on to see why what you see may not be what's happening and how a poor analysis can lead you to the wrong conclusion.
Approaching Analysis
There are three critical decisions when approaching an analysis:
- What data are you going to examine
- When, or what time frame, are you going to study
- How you are going to detail the results?
Let's take a look at an example.
Restaurant Holiday Sales
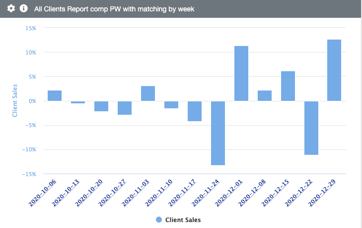
What do these two pictures tell you about restaurant sales over the holiday season?
 .
. 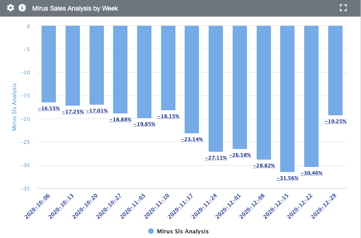
Both of these images describe restaurant sales performance from early October through the end of the 2020. Both are reporting the percentage change in Sales detailed by Week.
What's the Difference?
The primary difference is that the first image is comparing each week to the Previous Week, and the second image compares each week to the Same Week a Year Ago.
The comparison to last year, sometimes referred to as Same Store Sales, is one of the most common ways to measure restaurant sales performance. It is particularly effective to answer the question "How are things going relative to last year?"
Under steady operating conditions, when the macro economic conditions are similar from year to year, this is an effective analysis because it automatically adjusts for seasonality. But, it is less useful when events are very different between this year and last year. Sound familiar in this age of Covid?
The comparison to last year indicates that sales are getting worse relative to last year. The negative numbers are getting bigger. This is not an accurate assessment.
Data Relevance
The first image compares results to the same day Last Week. This technique is very useful when conditions are changing dramatically, and the reality of last year is less relevant. It tells us week to week whether the situation is improving or eroding relative to the previous week.
This type of comparison will not be useful when seasonality is a significant force. But, it does a really good job of telling us when something has recently happened that we need to pay attention to. Keep in mind this was the holiday season and our holidays don't fall on the same day or even the same week every year, so you see some peaks and troughs in the result. You can see Thanksgiving was one week earlier than 2020, and the same with Christmas.
What Do You See?
What does the first image tell you? To me, it says that restaurant sales were volatile during November and December. Some weeks were good, others not so good. This is the more accurate measurement between these two options. For the holiday season, restaurant sales were pretty much flat.
So, how do both of these images describe the same thing? They clearly look different. The answer lies in the sales for late November and December in 2019. The previous year ended with the best six weeks of sales for all of 2019. The reason the second image shows losses increasing so much has little to do with sales this year, but everything about the number being compared to, namely 2019. In absolute terms, sales were pretty flat, but relative to last year, the sales this year failed to keep up due to the conditions created by Covid.
Take Away
Measuring performance is a challenge because we constantly have to ask ourselves whether conditions are stable, or changing dynamically. This year it is Covid, but it just as easily could be a weather event that affects a big part of the country. Keep in mind, What, When, and How when deciding how to analyze performance. Use the technique that is best suited to the conditions in the market.
And, if your current reporting solution cannot easily give you the various permutations of calculations, perhaps it is time for a discussion with Mirus.


.png?width=50&height=50&name=Mirus%20Logo%20(1).png)