


For those following our irregular updates on the impact of Covid on restaurants, the world turned upside down for many in the past week. The picture below shows the last 7 days of Mirus Index. What do you think is going on?
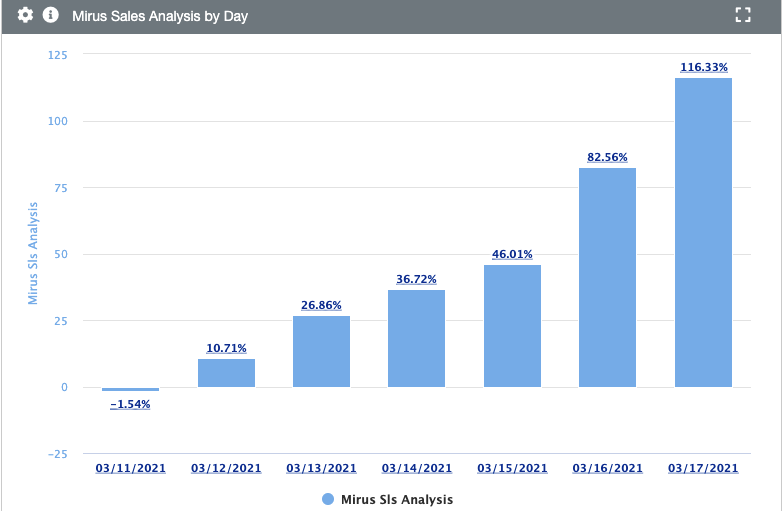
Mirus Index is a benchmark of chain restaurant sales and traffic measured as the percentage change from the same day last year. This picture covers March 11 to March 17, 2021 and is compared to March 12 to March 18 2020, when Covid-19 was just starting to devastate restaurants across the United States. March 11 was the last negative value in MIrus Index for the rest of this year, at least I hope so.
Let's take a look at what happened in March 2020...
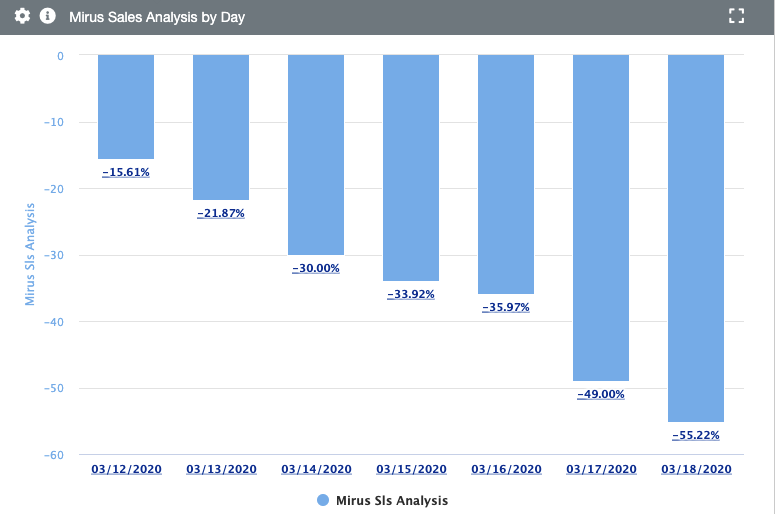
As you can see, the effect of Covid on restaurant sales was disasterous. Cities and states were issuing stay at home orders that closed most dining rooms. This was a scary period because we honestly had no idea how bad things would get, or how long the bad situation would last.
At the same time, March 2020 set the stage for what we are observing in 2021. Restaurant sales, when compared against the same day last year, are starting to take off in a big way. Some companies will see their sales increase 100% to 900%, depending on how bad they were hit in 2020. The bigger the devastation last year, the bigger the percentage gain will be this year. Don't be mislead by these big positive values.
These pictures can be misleading because they are only presenting the percentage change, not the underlying sales values. If you see that your sales yesterday are up 116%, that is not necessarily cause for celebration, at least not yet. Let's take a broader view of time with this next graphic.
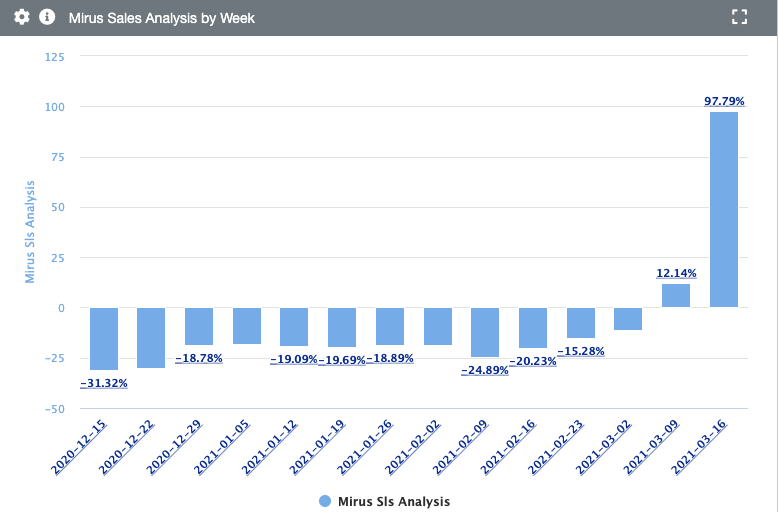
We are now looking at the last 13 weeks, which brings us back to mid-December. The dollar gain behind the 97.79% increase in the most recent week does not balance out the cumulative losses related to the other weeks in this visual. So, overall, sales are still down relative to last year.
One more chart to show the last point.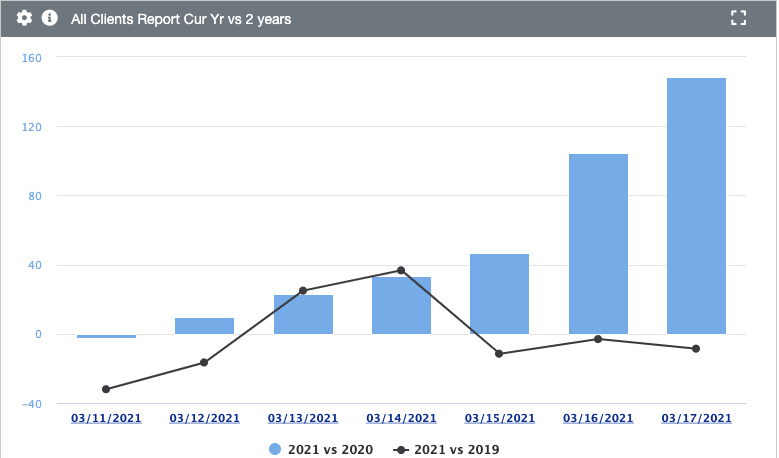
In this visual we compare 2021 to both 2020 and the same period in 2019. The black line is the comparison of 2020 to 2019, and while it has been positive two times in the past 7 days, it is still trending slightly negative. A piece of good news is that we are almost back to 2019 as an industry.
To wrap this up, enjoy the numbers you are about to see on your daily sales reports, but don't be fooled by big gains over 2020. For the rest of this year the comparison to 2020 will be misleading. Many Mirus clients have chosen to compare their results to 2019 this year to give them a better, albeit not perfect, measurement of their performance.
If you'd like to learn more about how you can easily adjust your reporting and analysis solutions, please let us know.
Or, if you prefer, learn more about Analyzing Restaurant Performance in 2021 by clicking the link below.
About Mirus:
Mirus is multi-unit restaurant reporting software used by operations, finance, IT, and marketing.
For more information, please visit www.mirus.com
If you enjoyed this blog, please share this post by using the social buttons at the top of the page and make sure to leave your thoughts in the comment section below!
Comments? Questions?


.png?width=50&height=50&name=Mirus%20Logo%20(1).png)