


There are two ways that a business can grow profits:
- Increase Sales
- Decrease Costs
As you might suspect, both approaches have their own unique set of challenges. But, regardless of which of these strategies you choose to deploy (more on this topic here), you’ll want to become intimately familiar with your Profit & Loss Statement as it will help you to gain insights into the strengths and weaknesses of your business. This post is filled with helpful tips to help you get the most out of your P&L Statement. Be sure to download our Top Restaurant Profit & Loss Reporting Tips guide at the bottom of this post.
Profit and Loss Statement
A Profit and Loss Statement goes by many names but whether you call it a profit and loss statement, a P&L, income statement, statement of earnings, or something else, it’s your window into how well your business is performing or not. In short, a P&L is used to reflect expenses that are subtracted from revenues over a given time period. The results can be as simple as you’re making a profit or not.
Keep in mind however, while a P&L is quite useful it’s only a reflection of what happened and as I’m sure you’re aware, you can do little to change history. And while you can gain useful insights from your P&L it would be immensely helpful to have it available for review as close to the beginning of the new period as possible – this way you can seek out areas to adjust sooner rather than later.
After reviewing your P&L, your next steps should be dictated by the results. If they are positive, great…you can make those next investments or pay down debt. Negative, well you’ll want to look closely and determine if cutting costs or increasing revenues or both are needed and how to best get that accomplished. At a minimum you should be reviewing your P&L with your management team at least once a month. This will help to identify any issues and equally important it will ensure that your team is aware of and aligned with the company’s goals and objectives.
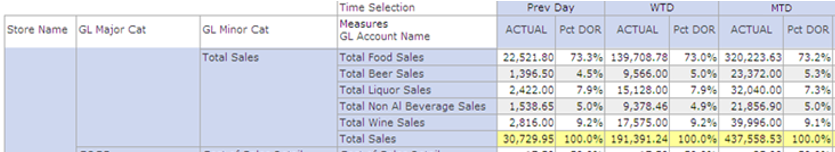
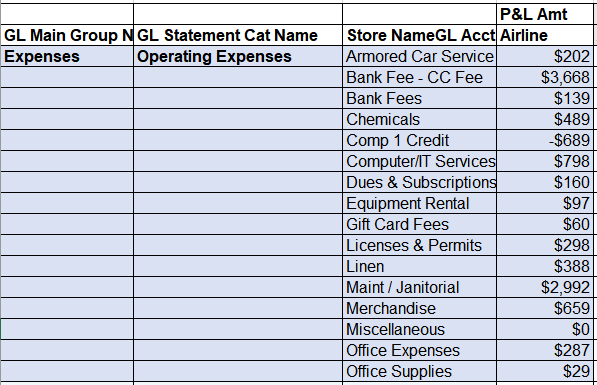
Better still, with the right reporting tool you can connect to your financial system and start delivering a daily, weekly, month-to-date view by location, of your P&L to any / all members of your team (partial view below).
While your P&L offers much in the way of understanding your operational activities it shouldn’t be used in place of your cash flow statement which reflects your financial activities. There are many reasons for this mostly related to the timing of collecting money and paying bills (more about this in Net Profit). Conversely, your P&L is not a replacement for your cash flow statement / balance sheet as there are other business activities (capital investments, prepaid expenses etc.), which will not be reflected in your current P&L.
Regardless, someone once told me that if their cash position was looking good, they were happy and didn’t need to look further. Arguably, your cash position is a solid indicator of financial health but it’s not a reflection on how well you’re running the operation. However, if you, like the individual that made this comment to me, are in a lifestyle business - meaning all you care about is that it’s generating enough cash to pay all your bills (personal and business), well, you can stop reading now. Otherwise, if you’re like many operators and you want to maximize your returns then you’ll want to dig into your P&L to gain insights into where improvements need to be made. And getting the most out of your P&L begins by understanding the sum of its parts and how they interrelate.
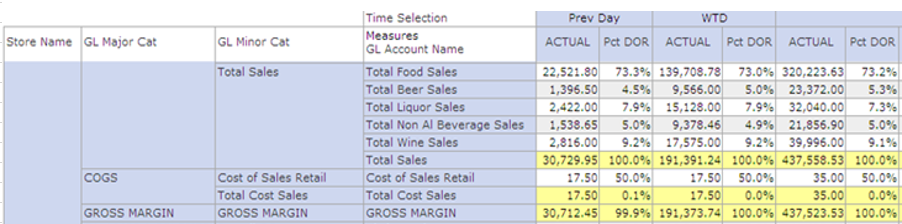
Income – Revenue - Sales
Your P&L begins with your income, revenues, or sales, which is the amount of money you receive for your food / drinks / merchandise or what’s also referred to as your – Top Line.
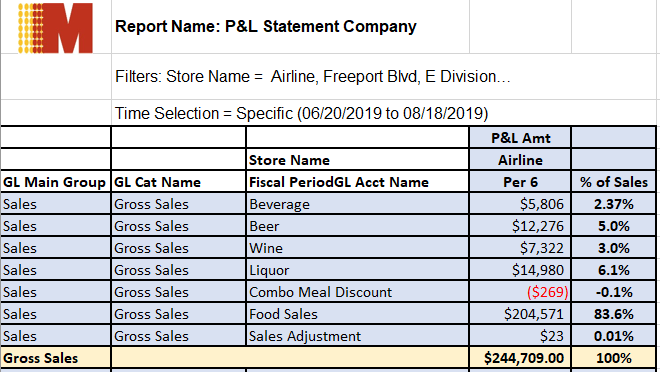
TIP: Adding a percentage of sales to your report will help you see each category’s level of contribution to the business. Keep in mind, however, that your percentage of sales will be more influenced by the price you sell an item for rather than its cost to make.
Prime Costs / Controllable Expenses
Prime Cost / Controllable Expenses are the total of cost of goods sold (COGS) plus all payroll-related costs, hourly staff, and payroll taxes and benefits. Prime costs represent the largest percentage of costs that are controllable, and controlling these costs is the best and most direct way to increase your net profit.
COGS + Labor = Prime Cost
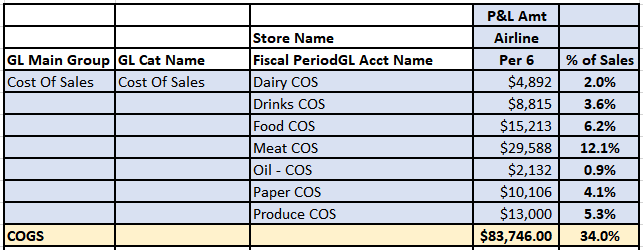
Cost of Goods Sold (COGS)
Cost of Goods Sold – also known as cost of sales is the amount of money your restaurant spends on supplies and ingredients for each of your menu items and it’s the first item subtracted from revenues.
Food cost percentages must be determined accurately if they’re going to be useful. To that end, make sure you use a consistent time period when reporting. When done correctly, food cost percentages can be used to compare against both the industry and your prior performance, which can be used to help improve operations and your bottom line.
To compute your COGS you’ll begin with your Beginning Inventory count which would be the amount of food / beverage in stock on the first date for the time period you’re looking to report on. You then add Beginning Inventory to the food / beverage items you Purchased during that same period and from that total you’ll subtract your Ending Inventory Count which, as you might suspect is the food / beverage items you have left at the end of the time period you’re reporting on The COGS calculation would look like:
Cost of Goods Sold = Beginning Inventory + Purchased Inventory – Ending Inventory.
Other important food cost calculations include; Actual Food Cost – Theoretical Food Cost – Food Cost Variance and while not found in your P&L we’ll not cover them as part of this Blog but you can read more about them in another post we’ve written; Restaurant Food Cost Controls.
TIP: COGS is normally reflected as a percentage of cost of sales and in general a profitable restaurant will generate a 25%-35% food cost.
Labor
While food cost is a major contributor another major cost contributor are your labor expenses. Unlike COGS, some labor expenses are variable in nature, such as crew labor, and some are more fixed, such as Manager Salaries. Other labor expenses such as Bonus payments are more discretionary, you pay them only when they are earned.
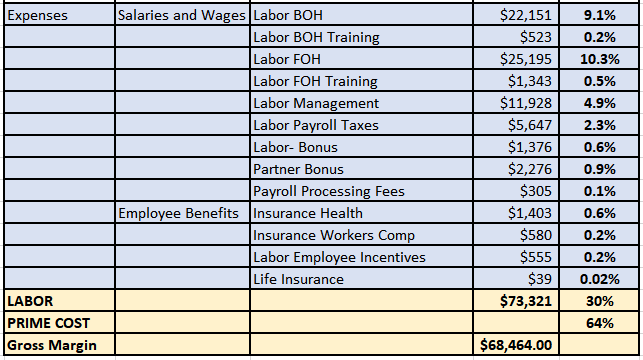
TIP: Food Cost and Labor together, should not exceed 65% of sales.
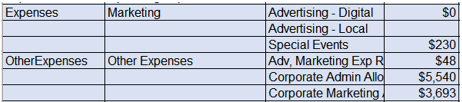
Other Controllable Expenses
Other controllable expenses is a category that includes Marketing, Advertising, Admin, etc., and are the type of expenses that management can exert some control over. Furthermore, grouping these expenses into categories like direct operating expenses, marketing expenses, utilities etc., will make it much easier to identify where opportunities to cut costs might exist.
Non-Controllable Expenses
These expenses include occupancy costs such as property taxes, building insurance, rent and other expenses over which you have little control to change.
TIP: If you take the time to separate controllable expenses from non-controllable expenses it will make it easier to gain insights into opportunities to further reduce spending.
Gross Margin
Gross margin is calculated by subtracting operating activities (COGS + Labor) from sales (gross sales - costs) for the time period reported.
As mentioned earlier, a P&L is a historical representation of what you’ve done and all too often a company’s P&L is not available for management review until a week or more after a period ends. As such, it’s not nearly as impactful as it could be if you had it available say on a daily, weekly or intra-period.
TIP: Expanding your P&L to include budget data can help you / your team pinpoint issues more quickly.
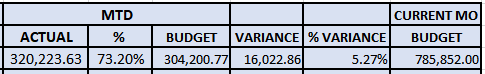
Include Budget Data with your P&L
General & Administrative (G&A) Expenses
G&A are all those costs that are not directly associated with the manufacture or sale of goods. A few examples of G&A expenses include building rent, consultant fees, depreciation on equipment, insurance, supplies, utilities, etc. Salary and benefits attributable to certain employees, such as corporate management as well as the legal, accounting, and information technology (IT) departments are also classified as G&A expenses. Some portion of these expenses are fixed, as they’ll be incurred despite the level of sales you might experience during any given period.
TIP: Because G&A expenses may be eliminated without direct impact on the production or sale of goods and services, you’ll want to review these expenses regularly to see if and where they may be minimized or eliminated.
Profit (EBITDA)
EBITDA stands for; earnings before interest, taxes, depreciation, and amortization and is a measure that looks at earnings before the non-operational and non-cash expenses are subtracted. EBITDA is a quick way to measure a company's overall financial performance.
- A positive EBITDA means that the company is profitable at an operating level: it sells its products higher than they cost to make.
- A negative EBITDA means that the company is facing some operational difficulties or is poorly managed.
TIP: Another use for EBITDA is measuring a company's profit as a percentage of revenue, also known as EBITDA margin.
EBITDA margin = EBITDA / Total Revenue.
Calculating a company's EBITDA margin is helpful when gauging the effectiveness of a company's cost-cutting efforts. The higher a company's EBITDA margin is, the lower its operating expenses are in relation to total revenue. On the other hand, A low EBITDA margin indicates that a business has profitability problems.
Net Profit (After Income Taxes) Bottom Line
Net profit (also called net income and/or earnings) is quite literally the bottom line of your business. It’s the number that you get after you subtract all your expenses from your revenue.
Net Profit = EBITDA – (Interest, Taxes, Depreciation, Amortization)
If your business is profitable after accounting for all your expenses, your net profit will be a positive number. If you have more expenses than revenue, your net profit will be a negative number to show that you lost money. If this number is negative, your business may be in trouble. You’ll want to review your expenses and also check your cash flow statement to ensure you have enough money available to keep your business running.
TIP: Even a profitable business can go under if it runs out of cash. OK, you may be wondering how a profitable business can run out of money. This can happen when a business makes sales that are booked as revenue on the P&L, but the actual cash hasn’t arrived yet. For example, your catering business is going great but much of the revenue from the sales your team made this month won’t be realized for up to 30-60 days (and sometimes longer!) Which means your profitable business could possibly go out of business because you ran out of cash.
Break Even Point
OK now that we’ve looked at the pieces and parts that make up a P&L, if you’re just starting out or hitting a rough patch in the first few months of operating your new restaurant business, I think it’s important to have an understanding of your break-even point. Why, well because a business’s break-even point is the stage at which revenues equal costs.
In short, this number is critical because it tells you how much you must sell to cover your investment. To determine a Breakeven point, you need to know your:
- Total Fixed Costs that your company incurs while it operates.
- This includes items such as rent, salaries, office expenses, depreciation and overhead.
- Total Variable Costs that rise and fall as volume changes.
- These include items such as inventory, raw material and production labor.
- Total Sales.
To calculate your Breakeven point let’s assume in one month your restaurant does $12,500 in sales and pays $4,700 in Fixed Costs and another $4,000 in Variable Costs.
Total Fixed Costs ÷ (Total Sales - Total Variable Costs) / Total Sales = Break Even Point
Let’s take a closer look to see what your exact Breakeven Point would be based on the numbers above.
Example: ($12,500 Total Sales - $4,000 Variable Cost) = $8,500
$8,500 / $12,500 Total Sales = 0.68
$4,700 Fixed Costs / 0.68 = Breakeven Point $6,911.76.
TIP: You can also use the Breakeven Point when confronted with the need to remodel, purchase new equipment or launch a marketing initiative. Knowing you’ll be spending your hard-earned money on something is one thing, it’s another altogether to say, it’s going to pay for itself in a specific amount of time.
Conclusion
Becoming intimately familiar with your P&L and digging in to it on a regular basis can help you determine how well your business is operating, as well as provide you with valuable insights into where steps can be taken to improve / maximize your company’s financial performance.
Restaurant P&L Tip Sheet
Click below to grab a copy of the Top Restaurant P&L Reporting Tips mentioned during this post to keep handy.

About Mirus:
Mirus provides services in data management and solutions in custom reporting for the restaurant industry.
Enjoyed this blog? Share it using the social buttons at the top of the page and leave your thoughts in the comment section below.


.png?width=50&height=50&name=Mirus%20Logo%20(1).png)