


If you are only examining your traditional same-store sales metrics today, you are not getting an accurate picture of the market realities or your restaurant's real performance. During an inflationary period, sales increases can look good but can also be misleading, or worse, lull you into a false sense of security. To see performance clearly during times like these, you need to recalculate your sales growth to eliminate the beneficial effects of inflation.
Mirus CEO, Dave Bennett, will be presenting his thoughts on managing restaurants during a high inflationary period at the Restaurant Finance and Development Conference. Learn how to calculate real revenue growth rates for restaurants and download Dave's expanded presentation slides and our free Real Restaurant Revenue Growth Calculation Methods PDF.
US Inflation History
For the last twenty years, we haven’t had to worry about the distortions in the data created by inflation. Since 2002, inflation has averaged 2.15%.
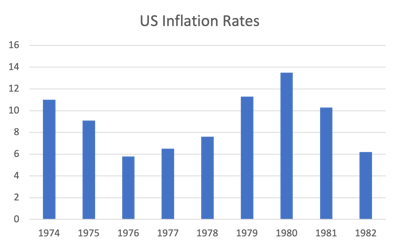
Before that, from 1974 through 1982, inflation AVERAGED 9%. That's nine years of inflation that peaked in 1980. But, while this is a long time, it wasn’t until 1986 that inflation stayed below 3% and was defeated, for 13 years! Even then, inflation was re-energized in 1987 and stayed above 4% through 1991.
This may be the first time some restaurant executives have had to manage during an inflationary period.
What is Real Revenue Growth?
Real Revenue growth implies a distortion with nominal growth or our standard comparable revenue growth, otherwise, we wouldn’t need the word REAL.
Most restaurant companies compute a Comparable Store Sales report that measures the % change in sales year over year in restaurants open for at least a year. New stores are eliminated because there aren't sales for last year to compare to – they are considered Non-Comparable. A Comparable Revenue growth calculation also includes the effects of price changes and changes in demand, and that is what can cause distortions.
Real Revenue Growth calculations eliminate the effects of price changes and depending on the technique used, can also eliminate changes in demand. This number is more comparable than other metrics to previous periods because it eliminates the distortions.
Why is Real Revenue Growth Important
Using Real Revenue Growth is like cleaning your windshield and getting rid of the dirt making reality easier to see. Deciding whether it is time to make investments requires a reasonable projection of revenues and cash flows. If your investment model is simply using comp sales, it can mislead you into thinking you have sufficient growth to pay for the investment.
Knowing your REAL growth rate is also essential in the valuation of your business if you are looking to raise capital, take on debt, or sell your company.
Real Revenue Growth Data
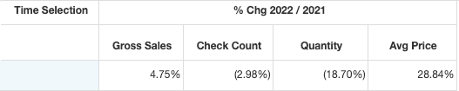
Like many things in the restaurant business, there are several ways you can eliminate the effects of inflation on your revenue numbers. There are a few types of data you will want to include in your calculations. The report example below is a comparable store report for the last 52-weeks, compared to the previous 52-week period, and we are looking at the percentage change in Gross Sales, Check Count, Quantity, and Average Price.
-
Gross Sales – depending on your business it may make more sense to use Gross versus Net sales, or vice versa, but in the example above, sales have gone up 4.75%.
There are three reasons sales can increase; each customer buys more things, each customer pays more for things, or by growth in the number of customers, or a combination of all three.
-
Demand – depending on your business you will either use Check Count or Cover Count and in some cases, you may need a combination of the two.
Here we see a decline in Checks by (2.98%)
-
Quantity Sold – there is another measure we all have in our data that is not often used to evaluate demand, and that is Quantity Sold.
You may scratch your head thinking about using Quantity, but it is critical to one of the key questions about the sales increase – did people buy more or fewer things?
In this case, the answer is fewer by (18.7%)
-
Average Price – finally, there is the Average Price paid by the customer and which has increased by 28.8% during this time.
So, a 28% price increase results in a 5% sales increase - not a good result I would say.
What happened? You can see overall traffic declined (check count) and the number of items purchased declined by a greater amount which means each customer is buying less, on average.
How to Calculate Real Revenue Growth
There are several ways to calculate REAL Revenue Growth.
The simplest way is to subtract the federal government’s measure of inflation from your comp sales number. You won’t even need an envelope to do the computation.
A second method can be used if your price increases were made by menu category – you calculate the same metrics at a Menu Category level and subtract the change in Average Price from the Gross Sales %.
A third option is to recalculate sales for last week, or last month, using the menu prices from before your price increases and calculating the difference with your comp sales metric.
Real Growth May Be Negative
A word of caution, based on my examination of many companies over the past few months there is a reasonable chance you may have negative REAL growth. It is likely the case for many companies.
When you experiment with different ways to eliminate the inflationary effect, many of you will see that your traffic has been declining.
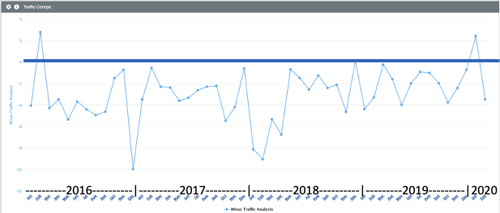
The chart above is from the Mirus Index, a proprietary calculation of industry sales and traffic performance. This report brings us back to the time before Covid to see what was happening back then. It runs from Jan 2016 through Feb 2020, just before Covid hit our restaurant businesses. The blue column here is the percentage gain in sales and the black line is the change in traffic.
As measured by Mirus Index, traffic across all forms of restaurants has been in decline for years. The industry has a traffic problem, and inflation is likely to shake things up even more than before Covid. If you are not actively analyzing traffic to your restaurants, you may not be seeing the complete picture and none of us want to end up in the ditch like our friend here.
One final point: Inflation went over 4% in April of 2021, so we could be wrestling with Inflation until 2034 if this ends up a repeat of the 70s and 80s.


.png?width=50&height=50&name=Mirus%20Logo%20(1).png)