


"POS, Meet BOH"
In today’s restaurant space, the business of owning and operating a restaurant is more challenging and competitive than ever before. This means it’s more important than ever to leverage technology to your advantage and no better place to start than using your Point-of-Sale system’s (POS) sales data combined with your Back of House (BOH) to help more tightly control your two biggest controllable expenses – food and labor costs.
Looking more closely, restaurant food & beverage purchases plus labor expenses account for 60 to as much as 68 cents of every dollar in restaurant sales. The combined total is referred to as; “Prime Cost”, and it's at this crossroads where the battle for restaurant profitability takes place. Why, because you have the ability to control these expenses. Unlike your fixed costs (lease, utilities, insurance, etc.), you can directly impact your food cost percentage by more effective purchasing, product handling and menu pricing and your labor with tools to help with allocation, scheduling and overtime reduction/prevention. More on the labor from an earlier series of Blogs.
The challenge, many companies use POS and BOH systems designed by different companies which mean, important data such as transaction level sales, inventory, food costs, invoices and in some cases labor scheduling are housed in a different system. Because these systems are different, you’ll find yourself logging in multiple places to get even the simplest of answers. Worse still, if you need a specific answer to a question challenging your business or are looking for trends, well then, in many companies data must be extracted from each source and then combined manually in a spreadsheet before insights can be revealed. Even when these systems come from the same provider there’s no guarantee that they’ll work together more effectively.
More importantly, no matter which POS / BOH solution is used, there's no ability to bring together data from other similar systems. Meaning, if you operate a fast casual that's using Aloha POS and also happen to operate a group of casual dining locations using Micros POS you'll have to put the data together manually to gain a holistic view. Additionally, bringing together your POS / BOH data with other 3rd party systems like loyalty, guest satisfaction, mystery shop data, etc., will be quite problematic. Best-in-class reporting and analytic companies, like Mirus, provide solutions today, that help restaurant companies capture and bring together (in one location) disparate data from any / all of the sources (well beyond POS and BOH) a company might use to operate and manage their restaurant businesses.
Solutions like Mirus Enterprise have the potential to improve operational execution, marketing insights and drive improved hospitality. Let’s examine a few areas:
- Menu item popularity.
- Do I have the inventory on hand to meet the demand?
- Do I have too much inventory on hand?
- Why are my food costs so high?
- How much Product should I prep each hour for each location?
- Food Quality.
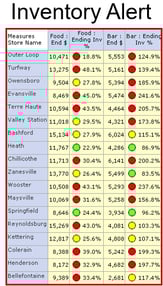
Do I Have Enough Inventory On Hand
Let’s start by looking at the importance of POS Sales to BOH Inventory data. Here, an inventory to sales ratio (BOH Inventory $ ÷ POS Sales $ = Sales to Inventory), can be used to measure the percentage of inventory the company currently has on hand to support its current sales needs.
Ideally, when combined, restaurant management should have a clear view into which menu items sell the most and if the ingredients to make these dishes are available so you don’t have to tell your customers; ‘Oh, sorry we don’t have that available tonight,’ which can then lead to a poor guest experience – and something I ran into just the other evening at a popular downtown spot.
Promotions create additional needs to forecast expected sales volume. Utilizing a solution like MIRUS Prophet, which applies a variety of algorithms in the forecasting process, can help identify down to the hour and by location how many of each product will be sold.
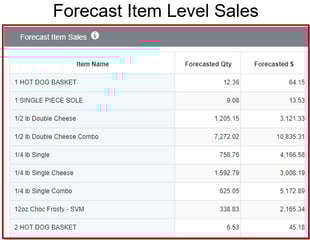
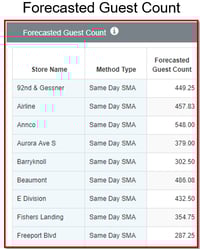
Reviewing sales in this manner will provide a baseline of each item anticipated sales performance. From there, rolling it up to City, State, Region, DMA, will provide further insights into inventory requirements and drive purchases.
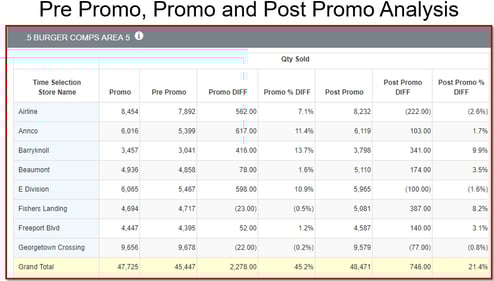
Active analysis during the promotion will allow an organization opportunity to order or transfer inventory as needed to keep up with demand and limit waste.
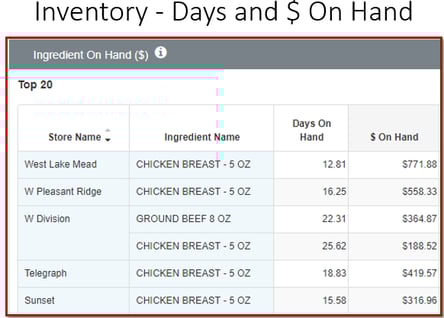
Do I Have Too Much Inventory On Hand?
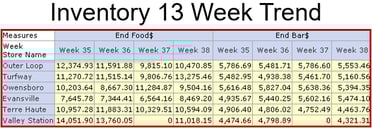
Having a high Inventory to Sales ratio can be an early indicator that sales have slowed. Once identified, it’s best to look at what’s been happening over a longer period to see this ratio over several periods reveals the restaurant managers ability to manage inventory. You’ll want to understand if it’s industry related or if you just have an inexperienced manager and they’re not forecasting their needs correctly. Or is it possible that the latest promotion’s success was overestimated by marketing? In any case, you’re tying up cash in product(s) that are not moving. And in some cases, it’s product that could easily spoil – in which case, the cash your company spent on this inventory would be wasted. Worse still, to keep COGS in line, managers may be tempted to sell an aging product which could lead to a poor guest experience. Having the ability to track and alert the appropriate management team members when these conditions exist can help minimize inventory loss due to spoilage.
So, how do you determine how much inventory is too much? The amount will differ based on the type of service you provide and your specific needs, however, a tool like MIRUS Enterprise can combine data from your POS and BOH and help you calculate how much inventory you have on hand. Using filters and exception based reporting techniques will help further identify specific locations/menu items where further review of the On Hand inventory is necessary.
In summary, inventory overages or shortages can be harmful to both your top line revenue and bottom line profitability. For example; for every $1 reduction in your inventory you’ll see a corresponding $1 increase in net income. That's incentive enough to keep a close eye on inventory.
Why Are My Food Costs So High?
It’s no doubt the road to being able to accurately compute your food cost variance is complicated and requires dedication and accuracy to ensure the information you’re reviewing is even remotely accurate. So, when completed, one would want to be able to use that information to their advantage. The first step is to identify where unacceptable variances may be taking place. Once you’ve narrowed it down to specific locations you can begin to dig further but it’s where to begin that I differ on with many other’s suggestions for uncovering the reason behind the variance.
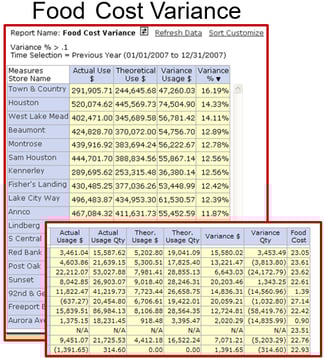
As you might suspect, given the challenges of creating an accurate food cost, there’s a long list of items capable of causing an unacceptable food cost variance. A few include;
- Inaccurate Inventory Counts
- Are ingredient costs correct
- Portion Control
- Tracking waste accurately
- Inventory adjustments
Food Cost & Theft
It's a given that inventory counts can be one of the more problematic issues related to food cost variances, and an area to dig deeper into, but I’d also suggest you first look at and rule out one of the more common drivers of food cost variances and one your BOH system won’t help you locate – cash theft. This is where check level detail from your POS will come in handy.
Experience has proven in far too many cases that theft was the principal driver behind larger than intended variances in food cost. Looking closely at the manager, server, bartender and cashier activities can more often than not, yield results that when corrected, will see your food costs coming back into line with expectations.
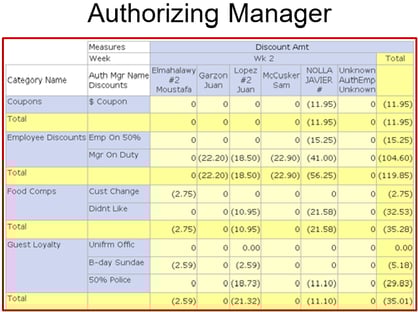
- Are managers discounting more than they should be?
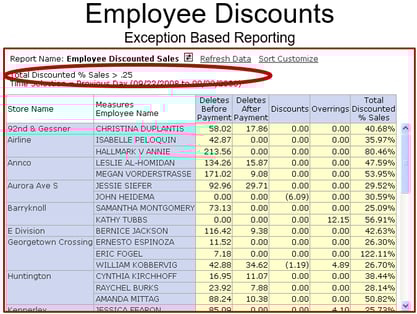
- Do you have employees who have high discounts?
- Use Exception Based Reporting to pinpoint just those employees that need closer scrutiny.
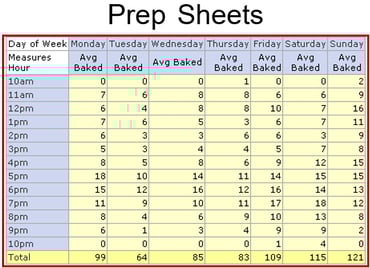
Be Prepared
The old Boy Scouts motto - be prepared. And in today's 'farm to table' kitchen operation it's wise to know before you go to the local market to purchase. Tally your prep sheet ingredient totals and then cross reference with inventory levels to ensure quantity on hand is sufficient to meet demand. You can be better prepared to meet sales demands and deliver a higher quality product by providing your kitchen staff with an accurate prep sheet based on past sales.
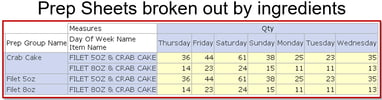
- Break out items into multiple preps
- Prep only what is needed
- Improve Speed of Service, Product Quality, Reduce Waste
Product Quality
Volumes have been written about food quality and quality assurance methods and it's not my intent to attempt to cover those issues here. As you saw above, knowing your quantity on hand can help keep inventory at reasonable levels, which should provide a hedge against added costs from waste due to spoilage or the temptation to serve something that's a little long in the tooth.
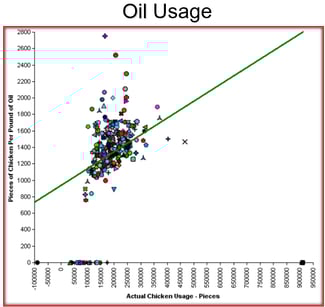
While food cost issues are problematic to one's bottom line, nothing affects top line revenues more quickly than driving away current / future customers than poor product quality. In this case, it's about fryer oil and we all know what happens when oil isn't changed in a timely manner. Combining product usage with oil consumption in this visualization (scatter plot) will help to quickly locate the outliers. The good news this same visualization will also help pinpoint those locations where oil is being changed too frequently - thereby allowing you to effectively kill two birds with one graph.
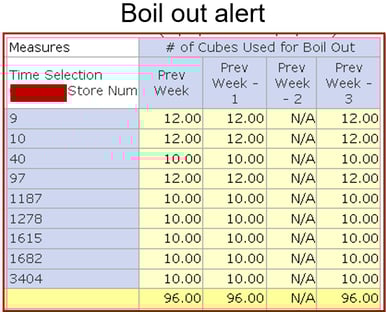
In tandem with changing fryer oil in a timely manner, another area where inventory data can be used to help ensure product quality is to help identify which of your locations is doing a boil out before adding new oil.
Before adding fresh oil to a fryer, restaurants should ensure the fryer's been properly boiled out to make sure all dirt and debris have been removed. Otherwise, you'll have contaminants left behind that will start to contaminate the new oil immediately when added. That will break down the oil quicker, leaving you to change the oil more frequently - ultimately costing you more time and money or most likely some unhappy customers!
Conclusion
The goal of leveraging your POS and BOH systems is to reduce general food costs and those associated with a surplus of supplies as food spoilage can have a significant effect on a restaurant’s gross profit. Owners are literally wasting money by throwing away food that has gone bad, and they must subtract this cost directly from their profits. In fact, it's been reported that across the restaurant industry as much as 3% to 10% of food goes to waste. As we mentioned earlier, for every dollar in inventory reduction, there is a corresponding rise in net income by the same dollar amount. That's better than waste any day.
In summary, to gain true business insight, you should implement a tool that will allow you to craft the custom reports containing the POS/BOH and other metrics you need to help you maintain control over your front of house/back of house operations. Furthermore, using these reports to regularly review your restaurant’s current performance to historical data will help you spot trends and identify areas of opportunity for improvement that will impact both your top and bottom lines.
Thoughts
Can you easily combine information from your POS, BOH and other 3rd Party systems used to operate your business?
Would it be helpful if you could gain greater insights into your business?
About Mirus:
Mirus is a multi-unit restaurant reporting, analytic and predictive software solution set used by operations, finance, IT, and marketing to gain deeper insights into the business.
For more information, please visit:www.mirus.com
Watch Mirus reporting demonstrations and client insights on our YouTube Channel
If you enjoyed this blog, please share this post by using the social buttons at the top of the page and make sure to leave your thoughts in the comment section below!


.png?width=50&height=50&name=Mirus%20Logo%20(1).png)