


May 1
Does anyone else sense that time is flying even faster than usual? You may not have this distorted sense of time if you are working from home, or laid off, but it is already May. Some thought at the start of this pandemic that all would be normal at this time. Seems like a silly, optimistic projection today, and we still have no clear picture on how the next several months are going to play out.
For those following this diary, I'd like to say thanks. And, if you have any thoughts or ideas you think would be constructive to our audience, please leave your comments at the bottom of this blog, or email me at dave@mirus.com.
Positive events continue to be revealed. Last week, the sales trend data indicated that we might have hit a bump in the road. Since then, the growth of restaurant sales has continued in a steady fashion. Here is the Mirus Index by Day for the month of April compared to the same day from the Previous Week. Easter is the first thing you might notice. There are two anomalies related to Easter, the week it fell on last year, and the week it fell on this year. The large negative is Easter this year, and the spike is the following Sunday when this year is compared to a weak Easter last year. Keep in mind these are same-store calculations, so a restaurant has to be open this year and last year to be included in these numbers.
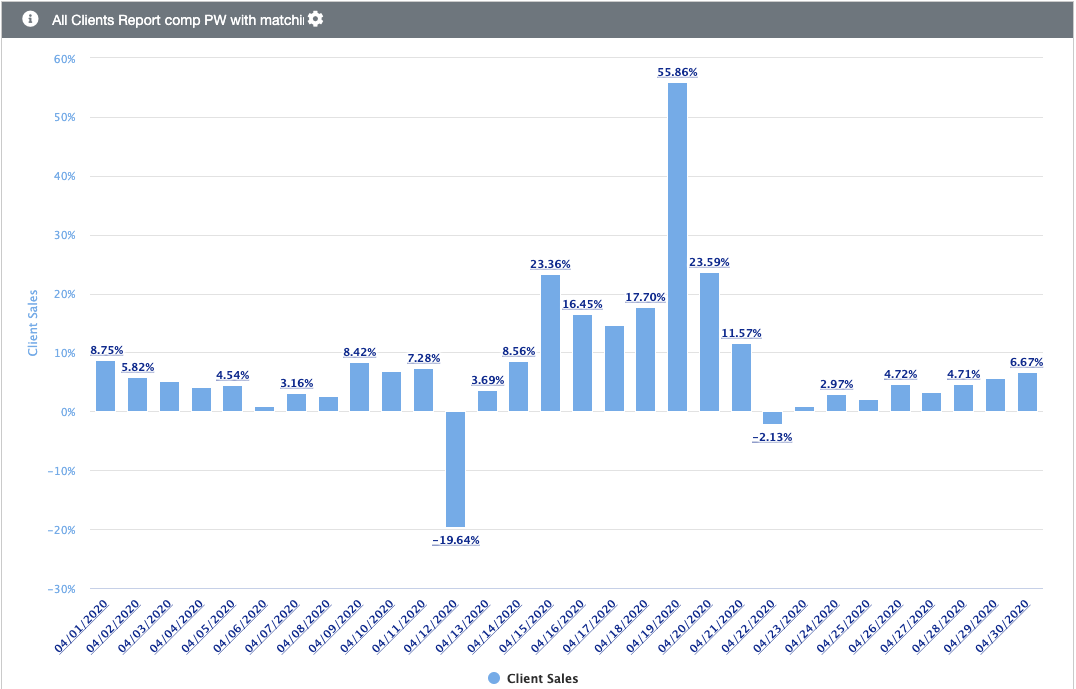
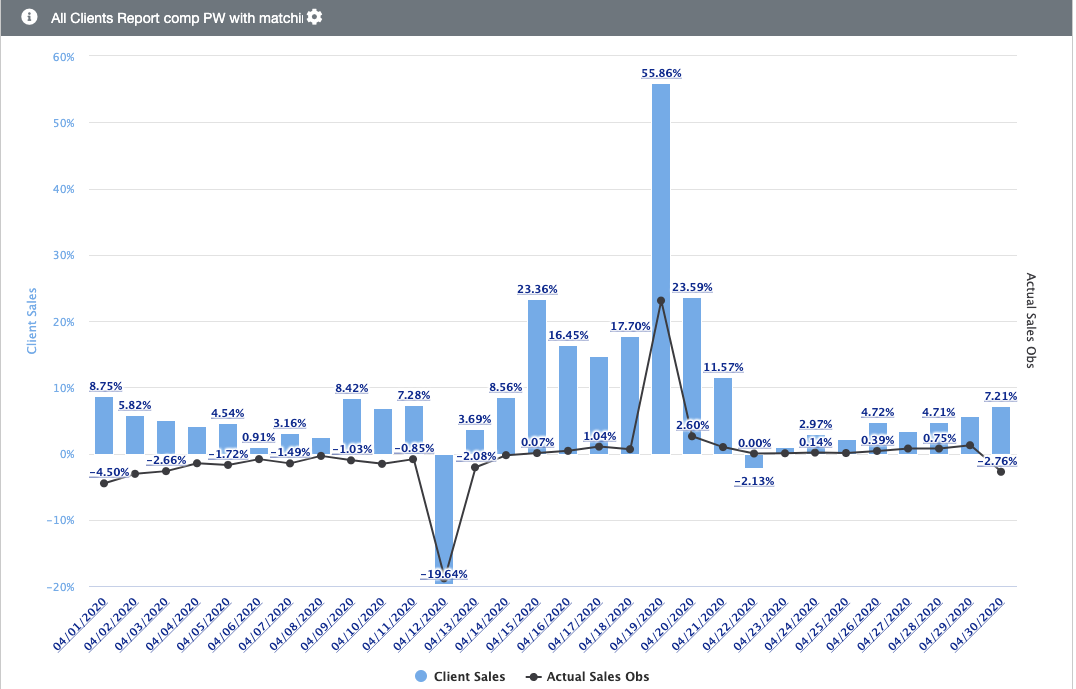
You can see that each day is about 3-4% higher than the week prior, after a post-Easter spike that is yet explained. We wondered if this trend was the result of higher sales in each location, or an increase in the total number of locations. So, we put the sales trend and the store count trend together for the following chart. Clearly, the number of locations operating has just recently gotten back to the number operating at the end of March, so the growth in sales is mostly due to higher sales volumes in each location. It makes sense that both operators and customers are getting used to, and executing better as time goes on.
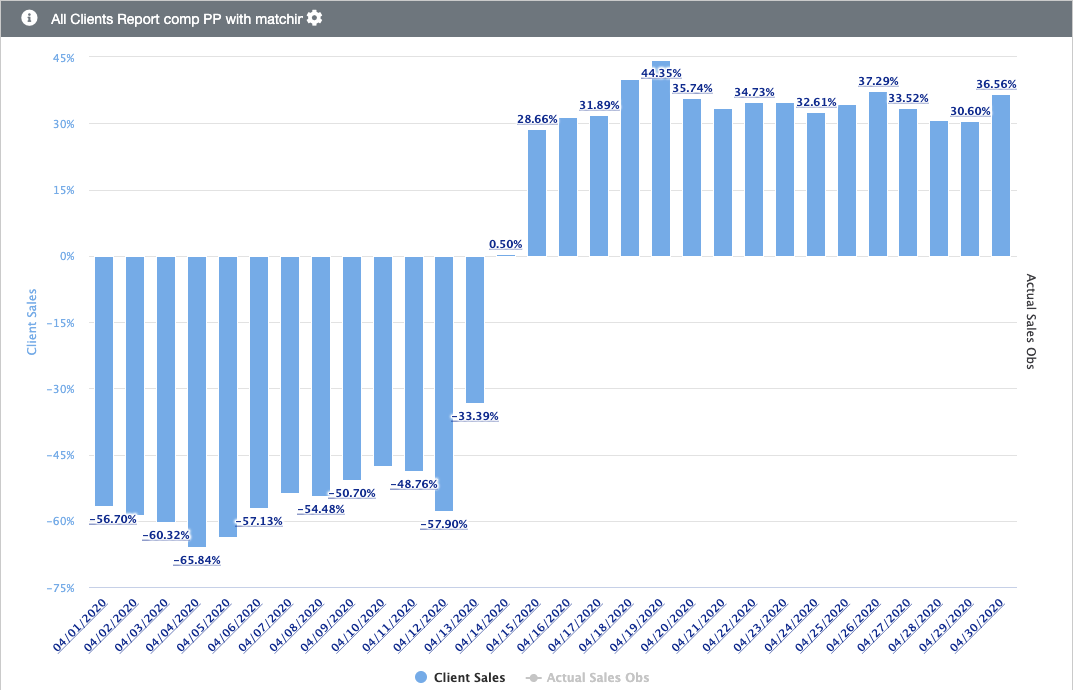
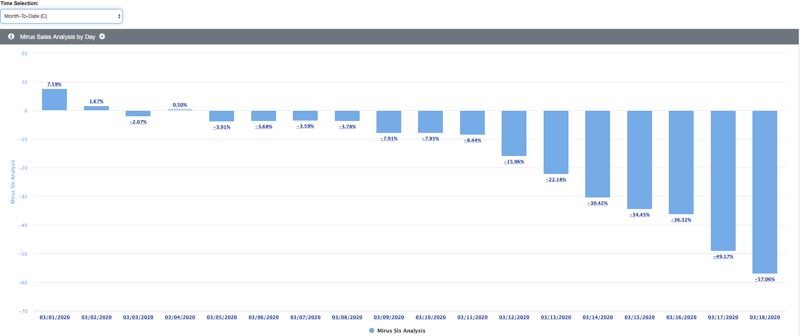
Finally, we came across this visualization that starkly sums up the speed with which things changed for restaurant companies. This chart compares each day to the same day from the previous month. So, in early April the negative growth is being compared to pre-closure sales in early March. The cliff in restaurant sales happened around March 15, after which sales fell dramatically. The switch to positive growth over the previous month is almost as dramatic as the fall, but it will be a few more weeks at this pace before sales volumes are restored to early March levels. The restrictions put into place between March 12 - March 19 by cities and states was the cliff for the restaurant industry. In just one week, hopes and plans for a productive 2020 were set to rest.
Dining rooms opened in several states on Monday, April 27. Another wave of states will open dining rooms today or this weekend. Unfortunately, we will have to wait until May 12, or so, before we will have clear data evidence as to whether these re-openings have created a second spike in infections. If there is a spike, we could be back into the April mode for quite some time. Hopefully, we can all take advantage of the opened dining rooms and behave responsibly, for everyone's sake.
April 24 Diary Entry
For those who have been following my posts and articles, you have heard the news that the sales of the restaurant industry hit their lowest point at the end of March. Since then, sales have been improving slowly on a week-to-week basis. In recent weeks, the Mirus Index has shown an increase in sales on a same-store basis.
Since Easter, the rate of sales increase accelerated to about 16%, that is until a couple of days ago.
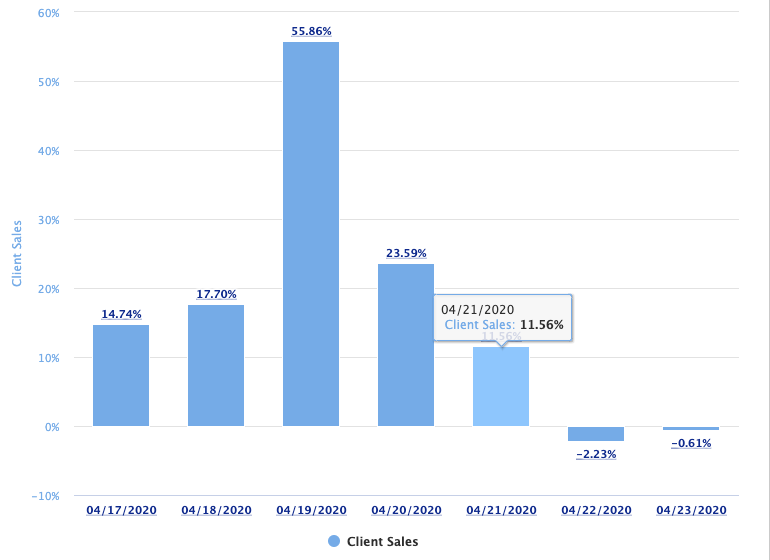
So, what happened?
April 22 and 23 were suddenly negative after a long string in positive increases over the previous week. This isn't really a surprise because April 22 was the first day to compare to a very strong day the previous week. You can see in the chart below that April 15 saw an increase of 23.3%. the small negative growth on April 22 was due to the strong previous week. Combined, the growth rate is about 10% for both weeks. Not bad in such crazy times.
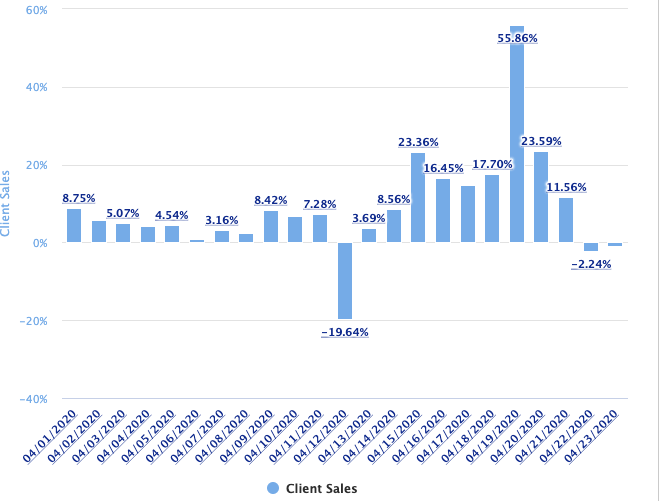
So, I will provide an update soon that will either show this is a short-lived phenomenon, or the start of a new trend.
Until then, please be safe!
April 20 Diary Entry
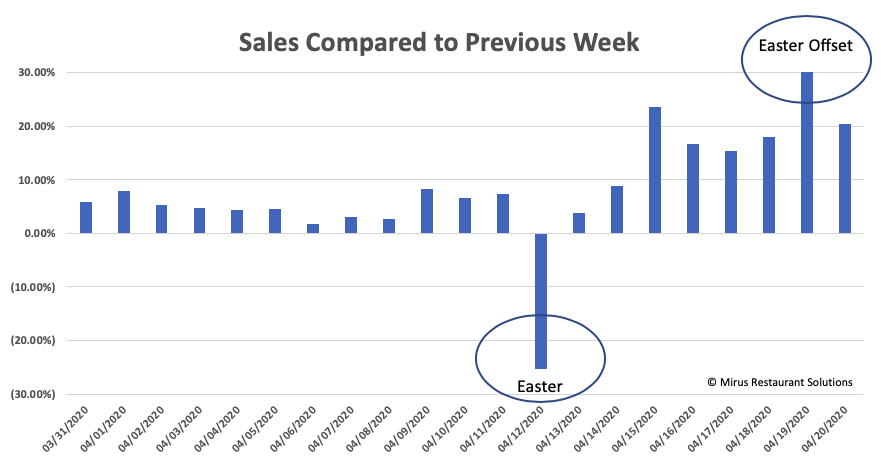
Things appear to be improving quickly for restaurants that are still operating. The chart below shows the 21 day period from March 31 - April 20, 2020. Each day is compared to the same day from the previous week. Easter is one of the holidays in the date range that has a significant negative effect on restaurant sales. The Sunday after Easter traditionally has a big lift over the previous week, and this year was no different with sales increasing over 60% (it has been clipped in the graph to avoid distortion).
Over this period sales have increased almost 10% while the same period last year experienced a sales decline of (-1.02%). In the week following Easter, the median increase over previous week is 16% - and that is eliminating the Easter distortion. The aggregate dollars for all locations still operating has been increasing for three weeks in a row.
Why are we seeing this type of jump in sales?
Keep in mind that the numbers here are only for restaurants still operating. Overall sales for Mirus clients, including restaurants currently closed, are still down more than -50% on average.
There are lots of factors that are changing quickly, causing the sales to jump around. However, my take on this trend is that both customers and restaurant operators are learning how to adapt to the new situation. Customers are learning how to buy curbside, for example. And, restaurant operators have developed innovative menus such as family bundles to help drive sales. The new normal is settling in, at least to some degree.
While some restaurants continue to close their doors, others are opening up. We know of one client who shut their restaurants down entirely for a few weeks. They spent the time on menus and getting the technology deployed for them to do curbside. Their plan is to reopen locations slowly, one market at a time. There is a lot of confidence behind those decisions, and it is good to see.
On April 20, the governor of Georgia announced that the dining rooms of restaurants could start to reopen on Monday, April 27. We know that decision contains a lot of risk, but also a lot of potential upside. It will be a watershed event and I hope it goes well because a setback would be devastating emotionally and economically.
Soon, we will be measuring the re-emergence of restaurant dining. How different do you expect life to be after Covid-19? Will the industry ever get back to the volumes of business it was experiencing in January 2020? Stay tuned!
April 13 Diary Entry
The restaurant industry started the year 2020 stronger than any year in more than a decade, although the impact of Covid-19 was already working its way into the numbers. Between March 12 and March 16, city by city, state by state shut down the restaurant dining room. All of the sports leagues also suspended operations. Curbside, takeout, drive-thru and delivery were now the only service channels for restaurants. That is when it hit the fan. Since then, is there any good news?
First, it looks like we have reached another plateau in the sales trend for all Mirus clients. If you have a restaurant operating today, it is likely doing a little better than last week.
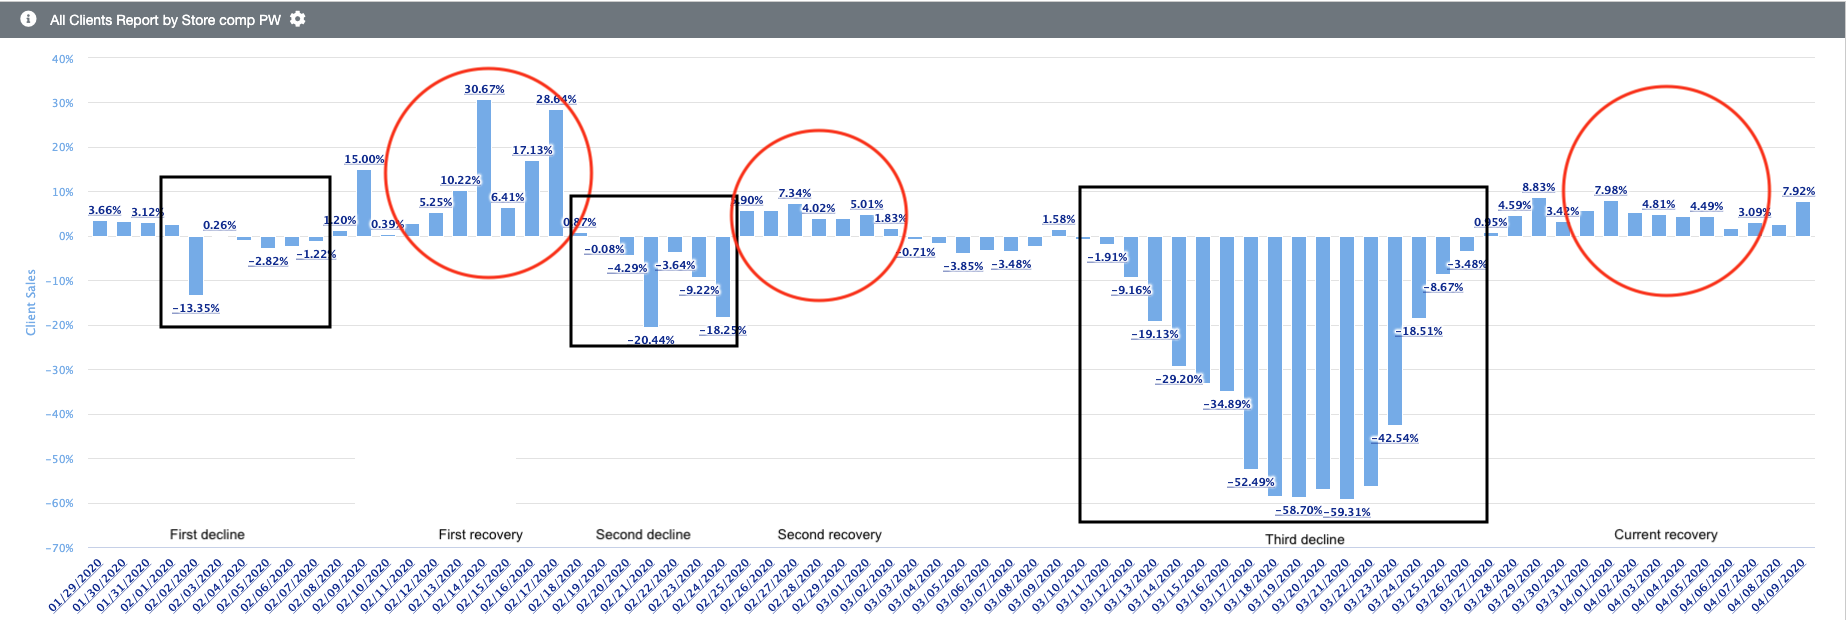
Second, the more we learn, the more complexity we see. For example, we now see in the data that there have been three cycles of decline and recovery since the end of January. The first sales decline we can see in the data is in early February, after the first set of cities had confirmed cases. The first confirmation was on January 21, 2020 in Washington state, and the first person-to-person transmission was confirmed in Chicago on January 30. The World Health Organization and the US declared a health emergency at this time, leading the first wave of restaurant sales declines.
The image below illustrates three cycles so far. This chart compares each day’s sales to the same day from the previous week. The first declines start on Feb 1 and last a week before sales recover a bit the following week. The second decline starts Feb 18 followed by the second recovery a week later. The big wave of sales declines started in early March, and by March 17 the restaurants that were still open were operating at about 50% of last year. The declines continued until about March 27, at least on a week-to-week basis. However, the first indication that a new bottom had been reached was on March 22, when the decline in sales dollars versus last week was smaller than the day before. In essence, we were clawing our way back to "0" from March 22 to March 27.
Compared to last year on a same-store basis the Mirus Index is still recording declines in excess of -50%. But, when compared to the previous week, we have seen steady positive gains for the past two weeks. For the restaurants that are still operating, things have started to improve. From March 28 to April 11, sales are have grown about 5.3% for restaurants still operating.
March 19 Diary Entry
During the month of March 2020, we posted results of the Mirus Index on social media to keep restaurant operators informed on what is happening at an industry level. This article is intended to be a diary of observations related to how COVID-19 is changing the restaurant world from our perspective. We will update this every few days during this pandemic to keep multi-unit restaurant operators informed of the bigger picture.
What's the Mirus Index?
Mirus Index is a measurement of same store sales and traffic across the Mirus client base. This data comes directly from thousands of restaurants across the country and includes data from every type of restaurant - from ice cream stands to fine dining. Sourcing the data directly from these restaurants protects accuracy.
Over the past decade the Mirus Index has been in sync with the larger benchmark measurements. It only includes restaurants that are open each day this year, and the same days from the previous year - something Mirus calls Matching logic. So, if a restaurant was completely shut down yesterday but was open last year, it is not included in the Index. The effect is to understate the negative in the current pandemic.
March 19, 2020
The restaurant sales impact of COVID-19 continues to get worse through March 18. For background purposes, the following picture shows what Mirus Index was reporting during the first two months of the year. The results were very encouraging given the sales trends over the past few years. February was softer than January, but this was the best start to a year for the industry in years.
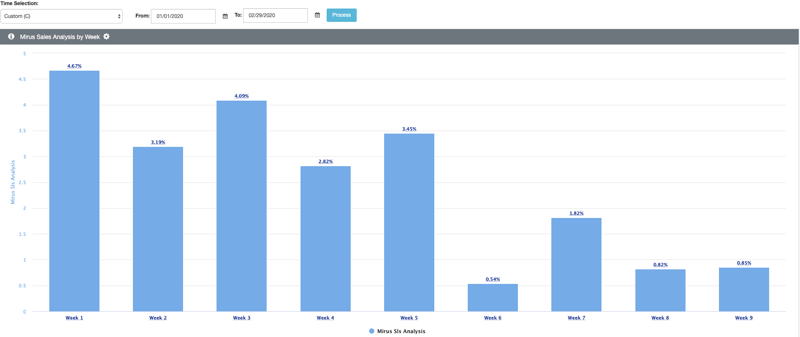
The last two weeks of February may contain some effect from COVID-19 in a few markets but the impact to the overall industry was small. Things started changing in March, and for many restaurants the decline in sales and customer traffic drove the industry negative on or around March 3rd.
By March 16, several cities, counties, and some states ordered restaurants closed for dine-in eating, and some cities shut down restaurant operations totally. The news of new restrictions on restaurants continues through the date of this posting.
If you are a restaurant operator and your restaurants are fully operational today, you are considered lucky. We have evidence that some restaurant brands are actually seeing a small bump in sales compared to last year, mostly in locations with drive-thru operations.
Since March 1, sales and traffic have plummeted. As mentioned earlier, these measurements do not include restaurants who have ceased operations this month. Overall, we are measuring a decline in total restaurants sales around <75%> versus the same time last year.
I feel disappointed in the local, state and federal governments with a bias against restaurant operators. There are a range of restrictions we see across the country. In some cities, restaurants can operate takeout and delivery, and others have forced complete closures, yet they allow grocery stores to operate with hundreds of people standing in line to check out.
In the US, half of the food dollars are spent in restaurants. The effect of these edicts/decrees/statues is to push the dollars that ordinarily would be spent in restaurants into the grocery vertical. I question whether grocery is any less safe than a restaurant, and I am sure the grocery chains are happy with a huge increase in their revenues.
Hopefully, cities and states with rethink their rules and allow restaurants to operate with reduced occupancy to maintain social distancing. Restaurants are trained to clean, and I believe most are able to maintain a safe environment, or at least as safe as a grocery store.
We all have a voice, and I ask you to consider letting your mayor and state government officials know that you want your local restaurants to be allowed to re-open.
Stay tuned in for updates!
Click here to subscribe to the Mirus Blog
Media Contact - marketing@mirus.com
About Mirus:
Mirus provides services in data management and solutions in custom reporting for the restaurant industry.
Enjoyed this blog? Share it using the social buttons at the top of the page and leave your thoughts in the comment section below.


.png?width=50&height=50&name=Mirus%20Logo%20(1).png)