


It seems like, since forever, that Product Mix or PMIX as it’s known, has been a staple in the restaurant arsenal for evaluating what’s selling and menu performance. And while, PMIX does deliver some interesting information like how many of x, y or z did I sell over a day, week, month, etc., it lacks the details needed to see shifts in demand, which makes it a poor choice to use when you’re wanting to make critical decisions about menu changes. For now, let’s look closer at what PMIX can deliver.
PMIX Basic Reporting
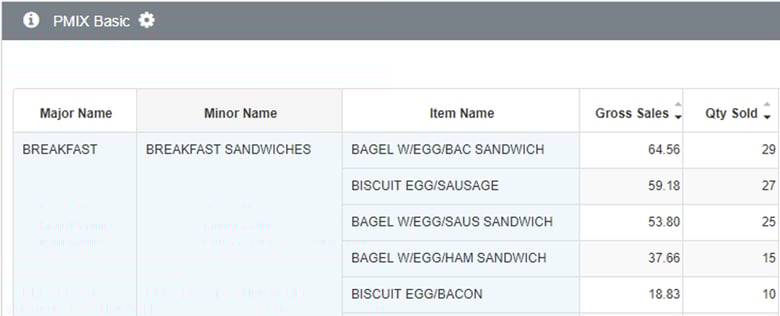
A Basic PMIX report provides, by major / minor categories, the number of items you sold along with the gross sales each item contributed for the time-period you select.
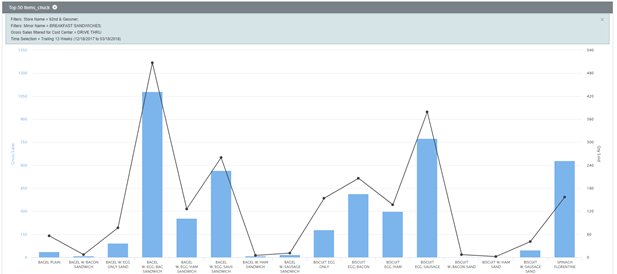
While telling the same story, (Gross Sales / Quantity Sold) a graphic view of the same items paints an interesting picture.
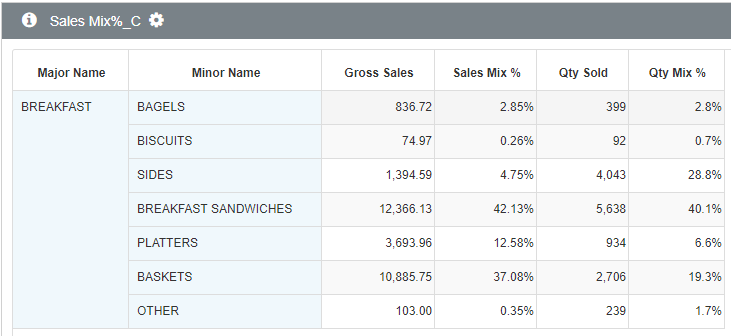
These basic views are helpful if all you want to know are your top selling items for a specific time period, but they can be enhanced to show more detail with a little extra effort. For example, once you have this basic information you can enhance it by computing the percentage of the Gross Sales each item represents, which gives you its Sales Mix %. To accomplish this, divide the Total Item Sales by the Total Sales. The same can be computed for the Quantity Sold or Quantity Mix %. This can be computed by dividing the Quantity of each item sold by the Total Quantity sold. Each of these percentages can help further define your view of an items performance relative to your overall menu / sales.
PMIX Intermediate Reporting
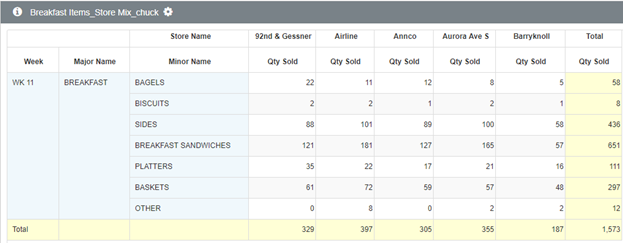
Looking at items sold by location can be used to create food ordering procedures which can be very helpful when looking to get control of one of your biggest cost buckets (Food Cost). Also, in the example above, it's clear that the Breakfast Items being sold vary widely by location. This information can be used to reduce prep times, improve product quality and reduce waste.
PMIX Advanced Reporting
With the addition of your item plate cost you’ll transform your basic PMIX reporting into a more robust sales-mix analysis. Adding plate costs to the number of items you’ve sold will provide you with each items profit margin / contribution margin and consequently the total profit margin for the restaurant.
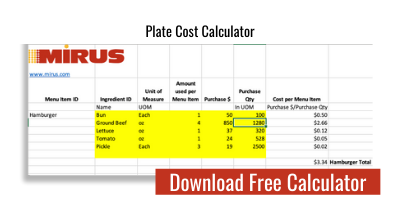
OK, before continuing, let’s talk about the term I just used -Plate Cost. If you want to perform a more robust PMIX analysis this is something you’ll need. So, what is Plate Cost and how do you get it? The plate cost (also known as Food Cost) is how much a dish or in this case, a plate of food costs you to produce. As an example, let’s look at a wild salmon dinner that you might get in your favorite restaurant:
- 8oz. Wild Salmon (at $15 per pound) = $7.50
- Mustard Sauce = $.50
- Potatoes = $.50
- Vegetable = $.35
Total cost to put that food on the plate = $8.85
$8.85 is your Plate Cost or Food Cost in terms of what the products cost.
The numbers ($) for the items noted above reflect what’s called the As Served (AS) cost, which is the cost of a single serving of that item. To achieve this number, you’ll take the cost of a product and divide it by the number of portions you will make from the item. For example, if you buy 12 eggs for $3, then by dividing $3 by 12 you’ll see that the AS cost of an egg is $.25. If you use one egg in your Mustard Sauce and the sauce makes 8 servings, then you’ll divide $.25 by 8 for the final per serving cost. Do this for each item individually.
It can get a little more complicated but this is the basics of plate cost. Once you have your total plate cost you can compute your selling price. In this example, I’ll use 35%
$8.85 / .35 = $25.28 rounding down slightly, the selling price on the menu $25.00. Menu Tip: If you happen to still put prices on your menu, what I see more and more is simply 25 next to the item - no dollar sign and no decimals.
Your food cost % =35.40% (8.85 divided by .25 = 35.4%).
The more you work with this the more you'll get a feel for costing your items and as you can see, the addition of cost allows you to determine, which items are delivering the best margins (Stars / Dogs).
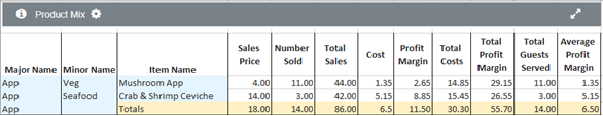
Those with the best margins are the stars on your menu and as such are the items you’ll want to try and have your teams sell more of. Here, you can even begin working to determine what menu items may need to be scrutinized more closely and possibly priced up / down, updated or replaced. Before you do this however, please note that PMIX data can only provide you with a hint at what may need closer review but before you make the final decision you’ll want to perform a more detailed Market Basket Analysis.
A market basket analysis utilizes more granular data ‘check detail’ and can therefore help you determine shifts in demand, cannibalization and more. You can find more on cannibalization here, market basket analysis here and the pit falls of trying to rely on PMIX alone, here.
Next, you’ll want to expand your sales-mix analysis by calculating another very important number Average Profit Margin Per Guest. To calculate, divide the total profit margin by the number of guests served. This number is useful as it can be used to determine the efficiency of changes to your menu. For example, if you offer a new special and this number goes up, that’s good news. However, if the number goes down, well, you might want to rethink that special because it’s clearly not making you more money.
Summary
In the end, no matter where you are in the PMIX reporting spectrum, you’ll want to make time each week to see what’s selling and what isn’t. Information gathered here will help you begin the process of identifying changes that may need to take place including deleting items, adjusting prices or more.
As mentioned throughout this article, PMIX alone doesn’t provide the detailed insights needed to finalize these decisions so, before undertaking major changes to your menu, it would behoove you to perform a more thorough market basket analysis of any items you’re considering making changes to as this client did and their results speak for themselves. Of course, I'd be remiss if I failed to mention that not all restaurant software is created equal so having a solid reporting software, like Mirus, can help make consolidating data and assembling reports much easier and quicker.
Conclusion
While PMIX analysis delivers useful insights that can help you make more money, sometimes a more hands on approach is equally useful in gaining insights. So, I’d recommend you take time on a weekly basis to randomly check menu items for proper portioning and while you’re at it, take a taste here and there to ensure that your restaurant is delivering the quality that you and your guests expect – in the end this is just one more way to make sure your customers find a reason to visit your restaurant(s) more often. And there’s no better way to make more money than that!
Thoughts?
Are you satisfied with PMIX data?
Dive Deeper
Product Mix is useful but you cannot measure things like cannibalization by simply looking at a product mix report. Click the button below to download the 3 Ways to Measure Restaurant Cannibalization PDF to learn how to dive into your even data deeper.

About Mirus:
Mirus Restaurant Solutions is a multi-unit restaurant reporting software used by operations, finance, IT, and marketing.
For more information, please visit www.mirus.com
If you enjoyed this blog, please share this post by using the social buttons at the top of the page and make sure to leave your thoughts in the comment section below!


.png?width=50&height=50&name=Mirus%20Logo%20(1).png)