


When a restaurant company originally adopts a restaurant analytics platform like Mirus, the decision usually hinges on one key issue within the company, whether that be:
- Consolidated reporting above store (Operations)
- General Ledger feed (Finance)
- Analysis of promotions or LTOs (Marketing)
- Payroll feed (HR)
- Visibility into franchise stores (C-Level)
Each of these key issues usually impacts a specific department, which can lead to the impression that the platform is only a FILL IN THE BLANK tool; only a Finance tool if you are using it to export to your GL system, or only an Operations tool if you are using it for consolidated above store reporting. However, you are losing out on the inherent value and flexibility of your restaurant analytics platform if you’ve got it siloed away into one area of your company.
Let’s review each of the key restaurant departments and see how a restaurant analytics platform can be tailored to meet each department's needs.
Operators & Store-Level Users
Above-Store Operators as well as Store-Level Users are looking at a lot of the same metrics, just at different levels of granularity. For example, the Store GM would see the reports with just their own store, while the Area Director would see the reports for all the stores in their Area.
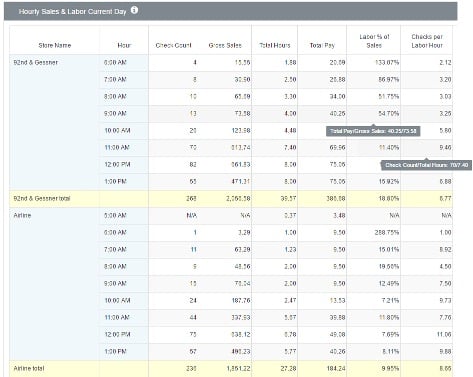
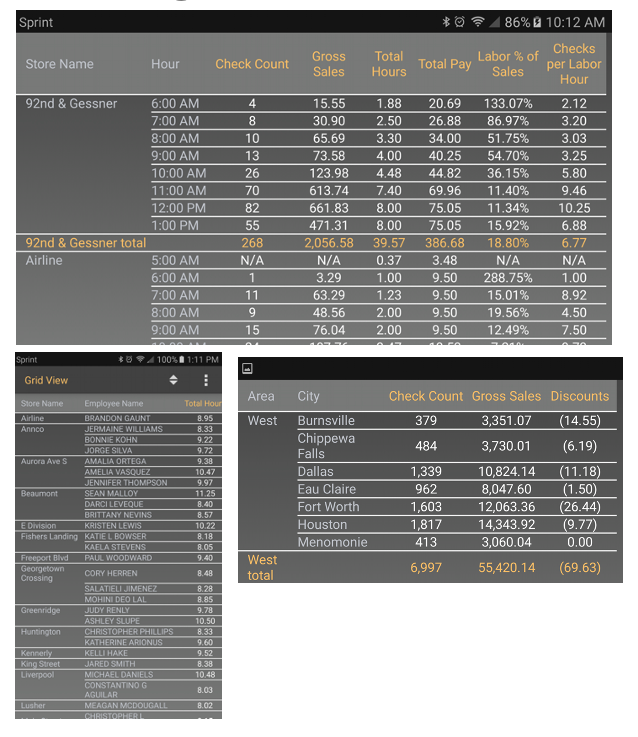
Intra-day Reporting allows a quick look at how the store is doing right now, today, in close to real-time. In this example, we are looking at a simple Intraday report showing Sales and Transactions with Labor Dollars and Hours. Notice there are two calculations built with the Mirus Measure Builder feature for Labor % of Sales and Checks per Labor Hour.
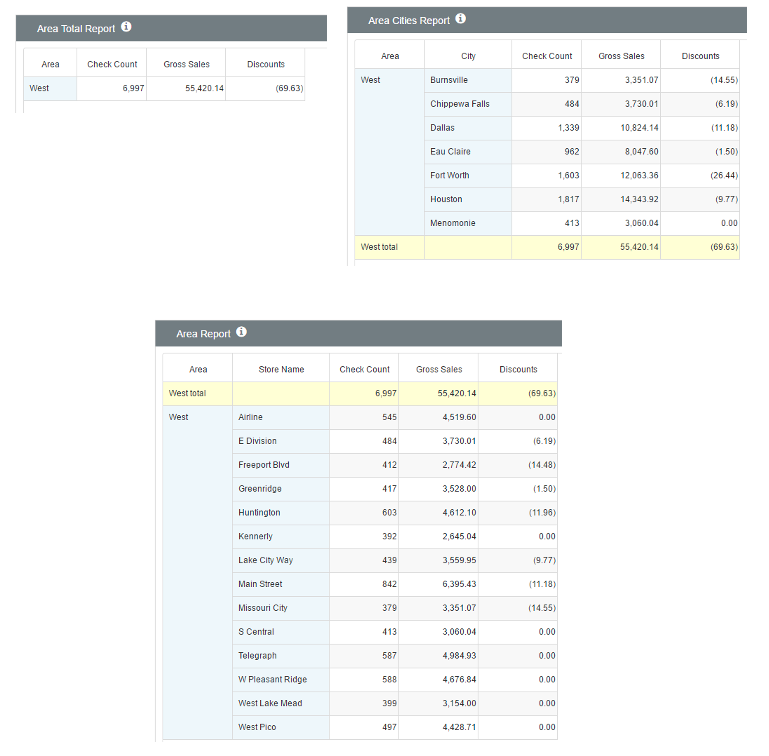
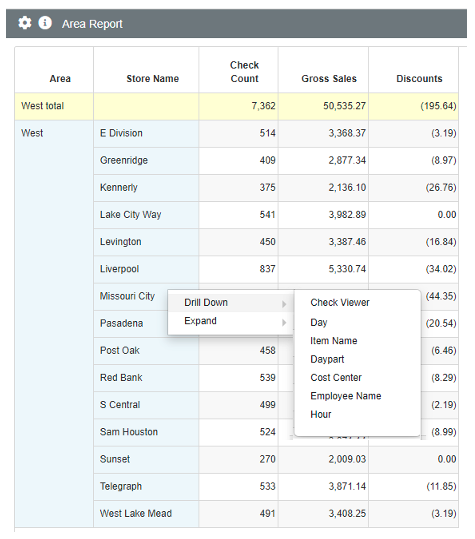
Next, we look at a basic report showing Check Count, Gross Sales, and Discounts, built 3 different ways to show the different options and flexibility of reporting. With In-Report Filters and Drilling features, you can take these simple reports and really dial into the details and filter on specific locations or even transactions that need attention.
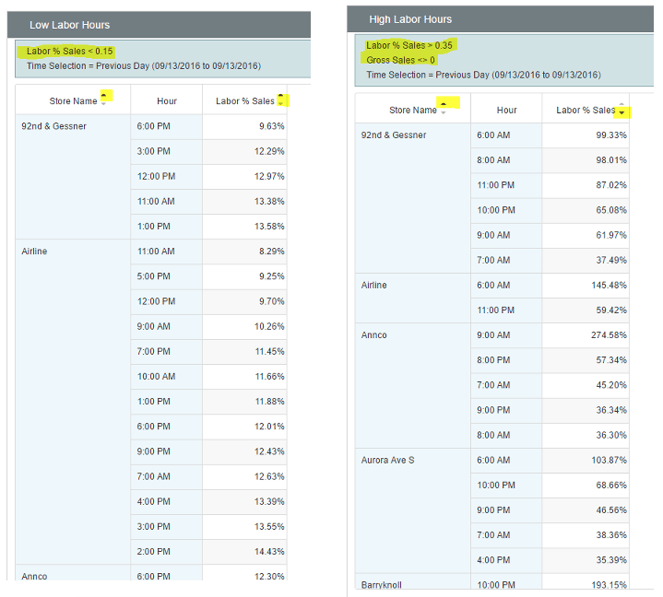
Here we have a few Exception Based Reports focusing on Labor. Exception Based Reports allow you to create custom parameters on a report, so the report will only return those details you are most interested in seeing.
The first two examples are showing the hours with the Lowest and Highest Labor %, to target hours that may need higher staffing or where potential cuts need to be made.
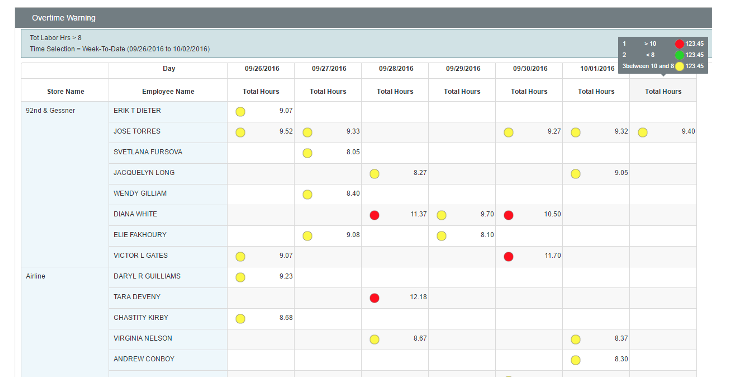
And the third is an Overtime (OT) warning noting which employees are in danger of hitting OT, allowing operators to make scheduling adjustments before their employees hit OT. This report allows includes our KPI feature. In the tooltip box, you can see that hours between 8 and 10 are flagged with a yellow stoplight, while any hours over 10 are flagged with a red stoplight. This allows users to hone in on the actionable data immediately, without having to sift through all the details.
Finally we have some examples of the Mirus Mobile App. Below are three reports we looked at earlier made into Mobile Reports. The Mirus Mobile App allows both Store-Level Operators as well as above store Operators to get a quick feel for how their Stores are performing while they are on the go.
Finance/Accounting
A restaurant analytics platform like Mirus can be a great tool for Finance and Accounting teams. Custom General Ledger (GL) Reports can be built in Mirus with your existing POS data or can be imported directly from your GL system, automated GL Exports can be created to feed directly into your GL system, and Exception Based Reports can also be used to identify and resolve issues.
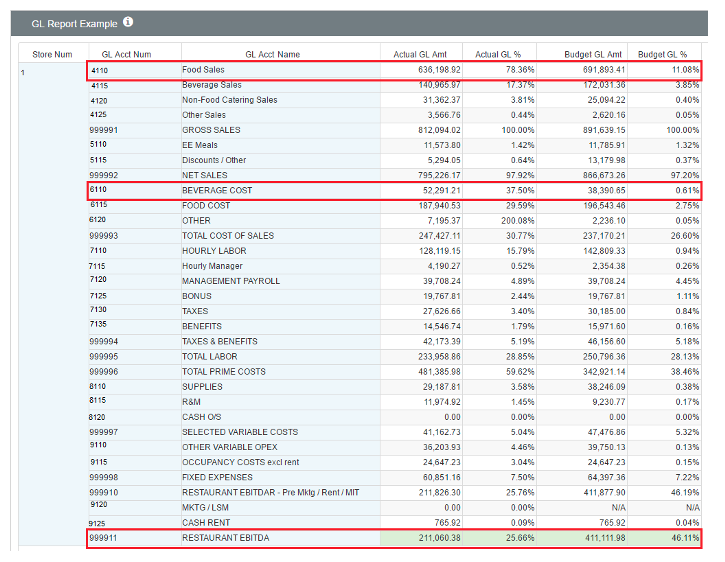
Below is an example of taking the data you already have in Mirus and creating business rules around it to create custom GL Reports in Mirus. For example, see GL Account 4110, this is simply Gross Sales for Major Cat Food, GL Account 6110 is simply Actual Inv $ for Raw Material Cat Beverage, etc. Also, with supplied calculations, we can create custom 'Total Lines' like EBITDA for your reports.
You may be familiar with report exports in the application, however, you may not be familiar with our custom export options. For most GL Exports we would advise a custom export. Custom export files are created on the back end to meet the given specifications for your GL system. With custom exports we are able to provide:
- Flexible Layout – produce exports in the exact layout your GL system requires without the format limitations of the Report Writer
- Custom Format – whether that's a .txt file, a .csv, or even a .xml file
- Automation – the export will run on the schedule you request, whether that’s daily, weekly, or by period
- Delivery – files can be delivered to FTP, SFTP, AWS, etc.
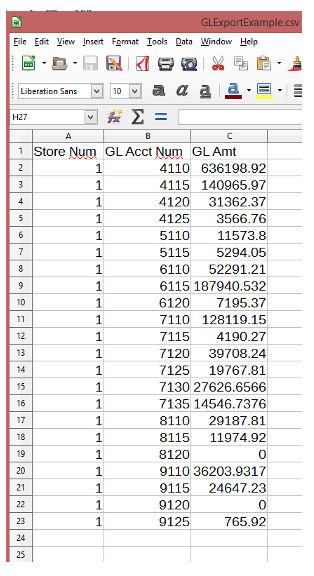
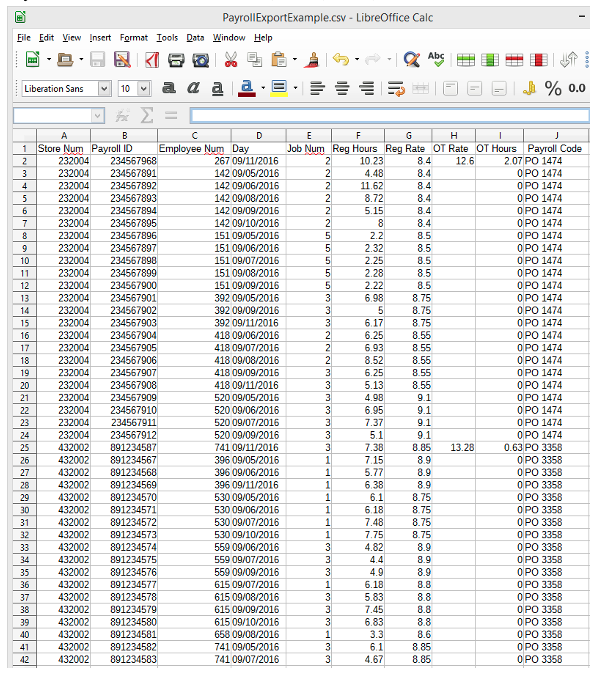
Below is an example of a simple GL export.
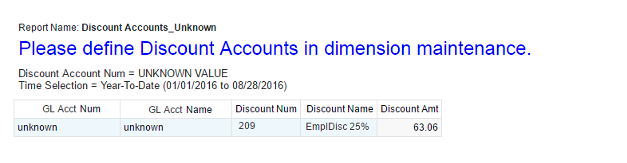
Next, is an example of an Exception Based Report for a client that has either a custom GL Report or Export, where a new Discount was added. This report will let the client know that the new Discount will need to be mapped to a GL Account so that it populates in their GL Report or Export. With Exception Based Reporting, you can set Alerts to only be delivered when your criteria are met.
Report in the application:
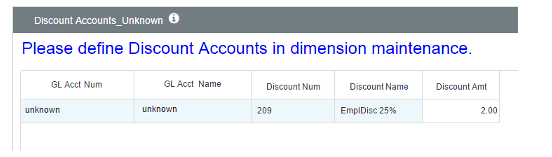
Report as received in an Alert:
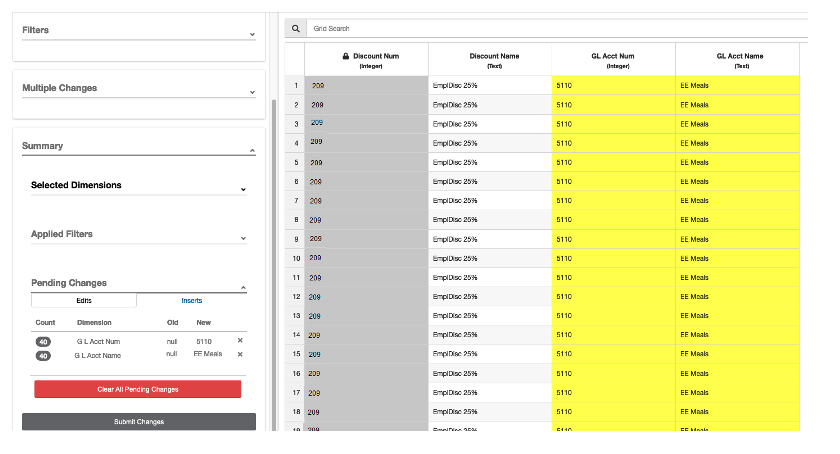
The mapping of the GL Account can easily be accomplished in Mirus' Dimension Maintenance tool.
You can simply filter for the specific Discount in question, select Multiple Changes, update the Account with the correct values and select Commit Changes.
Marketing
Marketing teams can use a restaurant analytics platform to track Promos and LTOs and review customer purchasing habits. Additionally, the integrations of Guest Satisfaction, Survey, and Loyalty data can really allow the Marketing team to see the big picture of how all these facets are working together and evaluate their success.
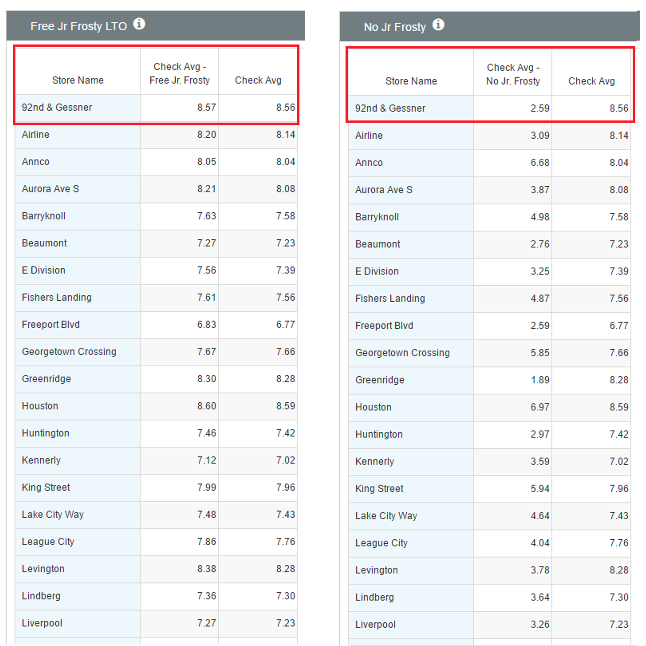
Here we have two N-Step reports built to evaluate how successful the Free Jr. Frosty promo was. In these reports we're not looking at how many promos were redeemed; instead, we're looking at the Check Average of checks where the promo was redeemed compared to those without the promo. And this promo seems to be pretty successful as the checks with the promo had a much higher average than those without.
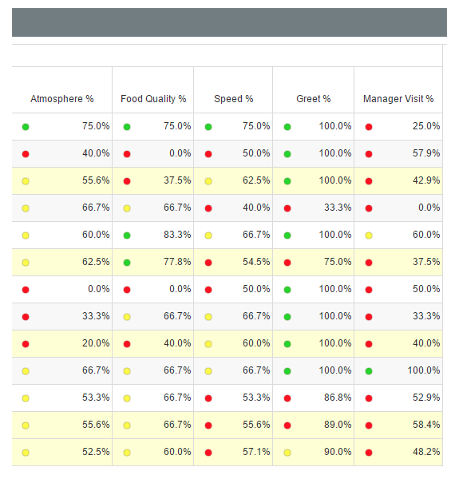
Next we have an example of a report from a Customer Survey Integration.
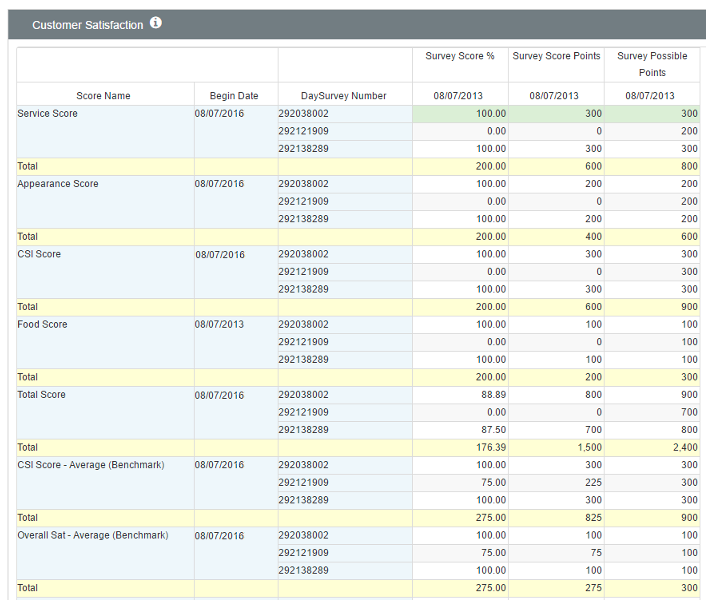
And here is an example of a report using data from a Guest Satisfaction Integration, again utilizing our KPI feature.
HR/Payroll
A restaurant analytics platform can help Payroll and HR Departments catch and correct labor issues before the end of the Payroll cycle, automate Payroll Exports that feed directly into the Payroll system, and track and monitor labor throughout the payroll cycle.
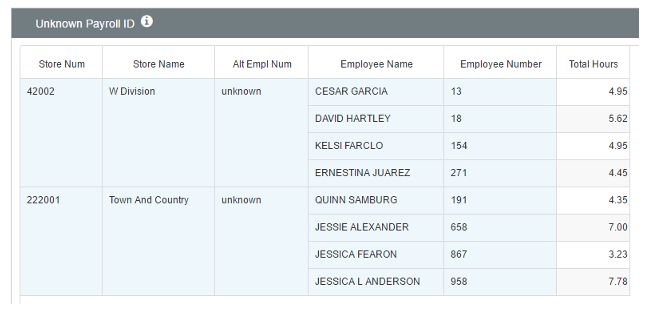
Below is an example of an Exception Based Report to review all new employees who have not had their Payroll ID assigned. This can be a real headache to try and clean up at the end of the payroll cycle, so giving your team visibility to manage this throughout the cycle will help alleviate the backlog.
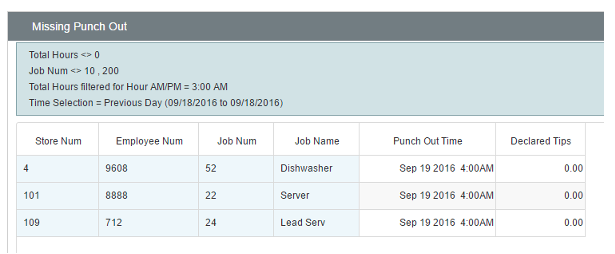
Another example of an Exception Based Report the payroll department may use is Missing Punch Out Times.
In this example we know all the stores close at 10:00 pm, so there should not be any Labor Hours after Midnight. We also know the that Point of Sale (POS) End of Day runs at 4:00 am, and any employees on the clock at this time will be assigned a Punch Out Time of 4:00 am.
In this report we have filtered for any Labor Hours in the 3:00 am hour excluding any Manager Job Codes, this allows us to see any Employees with a missing Punch-Out.
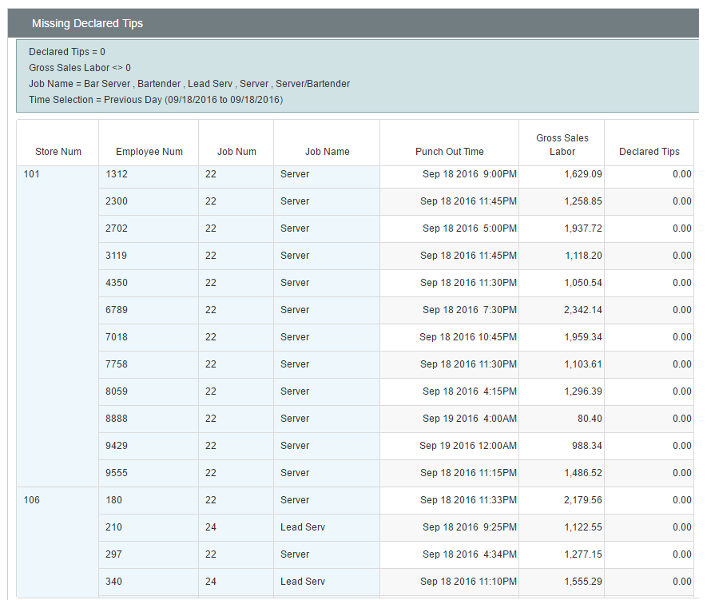
A third Exception Based Report example identifies employees who did not claim tips.
In this example we have the report filtered for only Job Codes that are tip credit wage, so servers & bartenders. Then, we have the report filtered to show any employees who have Declared Tips of zero, but Sales not equal to zero. This will throw out any accidental punches, where an employee clocks in one minute then out the next, or any legitimate shifts without sales, like an employee who clocked in, never got sat, and then was cut a half hour later.
In all these examples we are able to pinpoint the specific employees or punch-in issues so the managers are able to immediately address the issue, instead of having to sift through all the data to find the issues. This will allow your team to work more efficiently and allow issues to be handled throughout the payroll cycle instead of bottle-necking and having your team try to resolve all these issues at the end of the cycle.
Just like with GL Exports, custom payroll export files can be created on the back end to meet your given specifications. With custom exports, Mirus is able to provide:
- Flexible Layout – produce exports in the exact layout your Payroll system requires without the format limitations of the Report Writer
- Custom Format – whether that's a .txt file, a .csv, or even a .xml file
- Automation – the export will run on the schedule you request, whether that’s daily, weekly, or by period
- Delivery – files can be delivered to FTP, SFTP, AWS, etc.
C-Level Executives
C-Level executives can use a restaurant analytics platform to view high-level reports, while still having the flexibility to drill down into reports if they are wanting to take a deep dive.
And since all their departments are taking advantage of such a platform, they will also benefit from the increased productivity of their staff!
If you're wondering how your company can get the most out of a restaurant analytics platform like Mirus, then ask each of your departments:
"What is the one task that takes up most of your time?"
At Mirus we work with our clients to help identify ways to automate tasks completely or reduce the time involved by creating key reports that speak to the issue.


.png?width=50&height=50&name=Mirus%20Logo%20(1).png)